We ran the numbers — these are the five SERP features dominating the search landscape this year.
There’s no doubt that search is constantly evolving, so we decided to hold a magnifying glass up to the SERPs — their SERP features, to be exact, to see what they’re up to these days.
For example, which features appear on the most SERPs? Which own the most visibility? We uncovered some surprising SERP revelations and surfaced a few key takeaways, so buckle up — it’s time to for a deep-dive into the data.
- The methodology
- The SERP features that appear most often
- Layering in share of voice to determine prominence
- The top five most visible SERP features
- Top takeaways
The methodology
First, we gathered our keywords in STAT, landing on the trusty MozCast dataset — 10,000 head terms used and consistently tracked for many years now to monitor Google algorithm behaviour.
For each head term, we pulled the SERP for every combination of US-en and GB-en markets on desktop and smartphone devices, which gave us a grand total of 40,000 unique keyword SERPs to dig into.
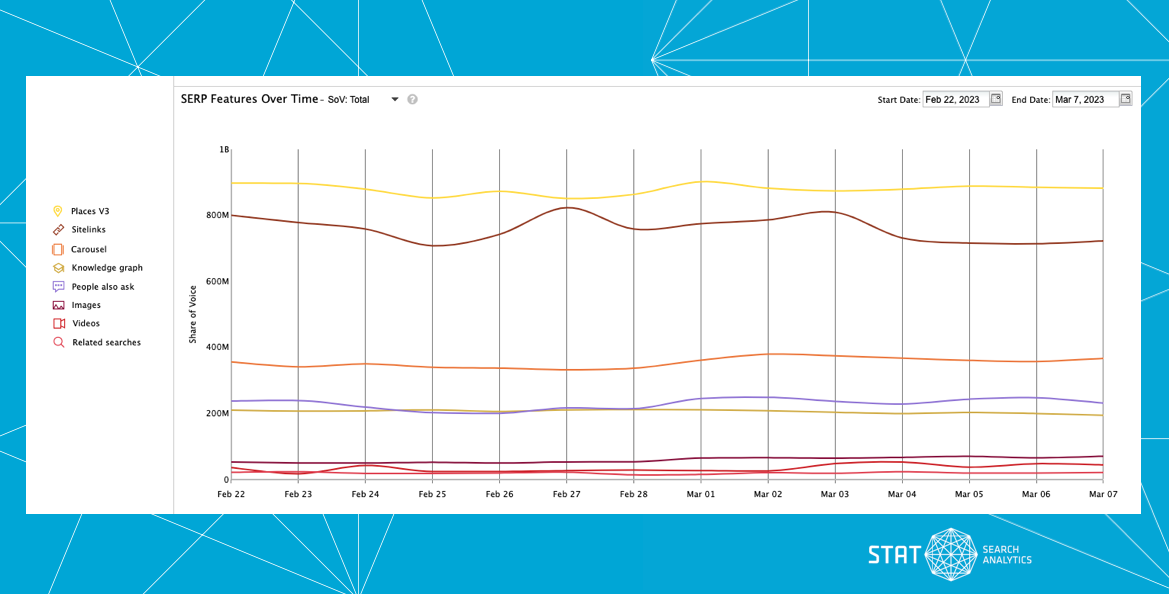
We pulled 14 days’ worth of data (February 22–March 7, 2023) to both increase the sample size of our study and allow us to monitor the volatility (or lack thereof it turns out) of our SERP features.
SERP features over time
A pretty stable bunch.
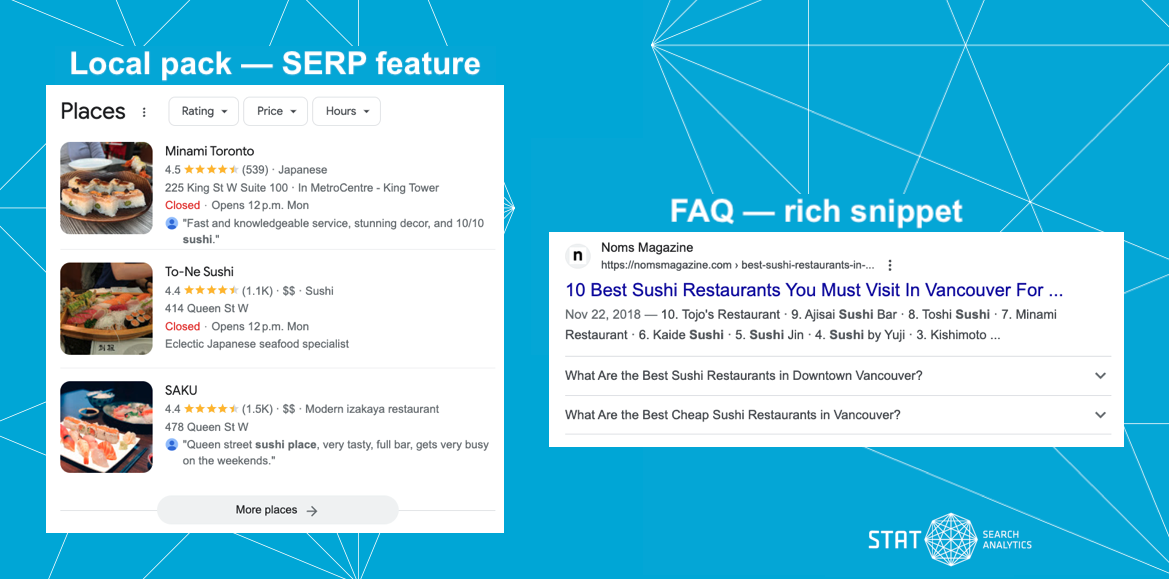
Lastly, we did some SERP feature defining. Arguably the hardest step of the process. For the most part, we chose to look at the more “old school” types of SERP features — the ones that you’d be hard-pressed to define as a 10-blue-link organic result and are more at the whim of Google, such as featured snippets, job boxes, and knowledge graphs.
This largely excluded the “rich snippet” category — the more small, structured pieces of data you can surface more easily on your organic result, like ratings and FAQs. But given their expansion on the SERPs these days, rich snippets warrant their own study, so we’ll do those next.
SERP feature or rich snippet? A sticky subject
The definitions can be debated, but we’re drawing a line in the sand between what we are classifying as a SERP feature vs. a rich snippet.
Now onto the findings!
Related searches appear most often
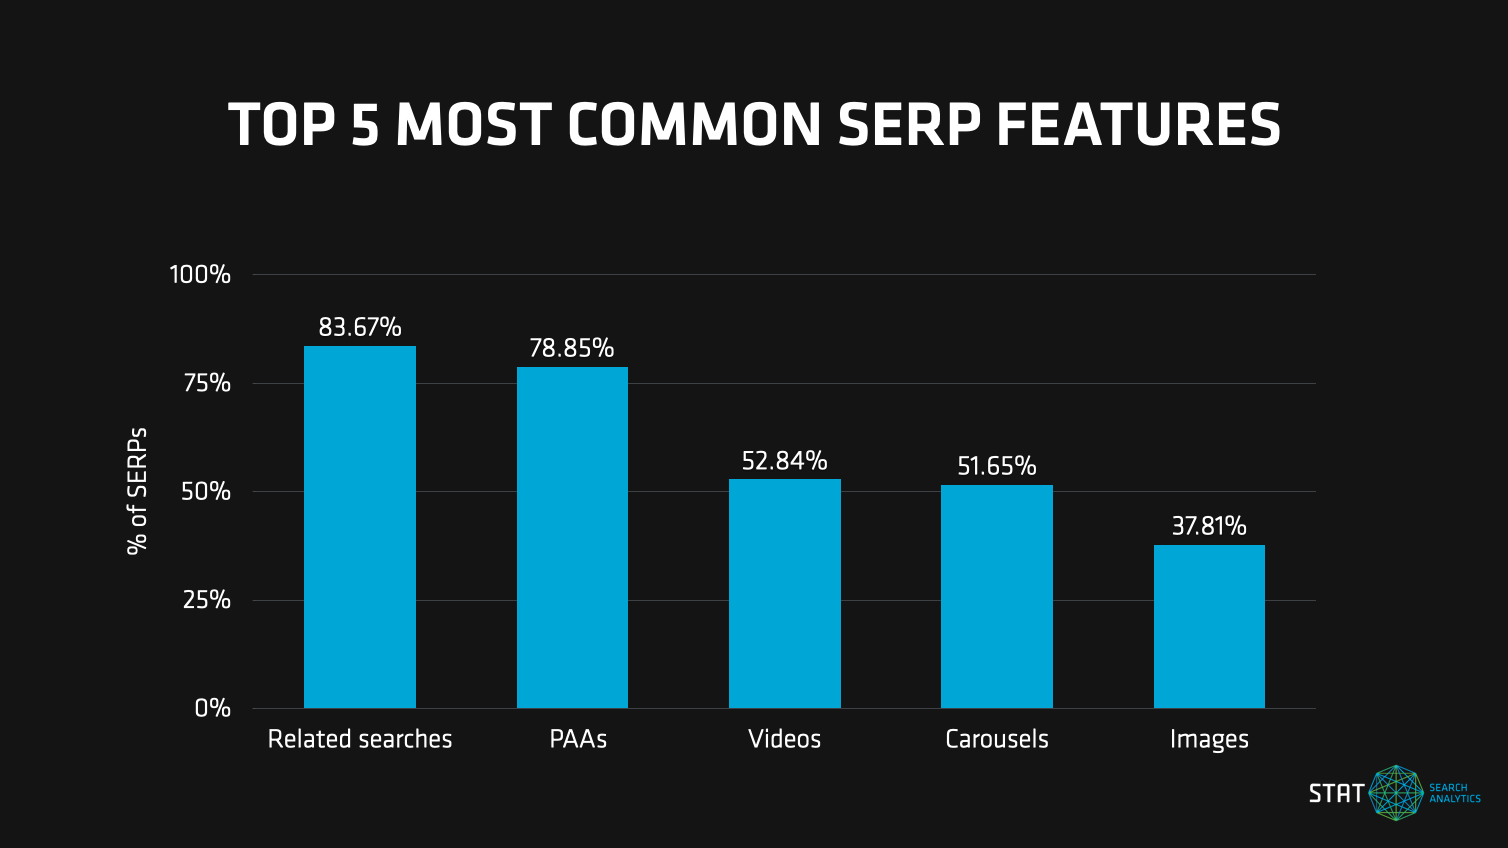
The most commonly occurring feature in our data set was related searches, which appeared on a grand total of 83.67% of our SERPs.
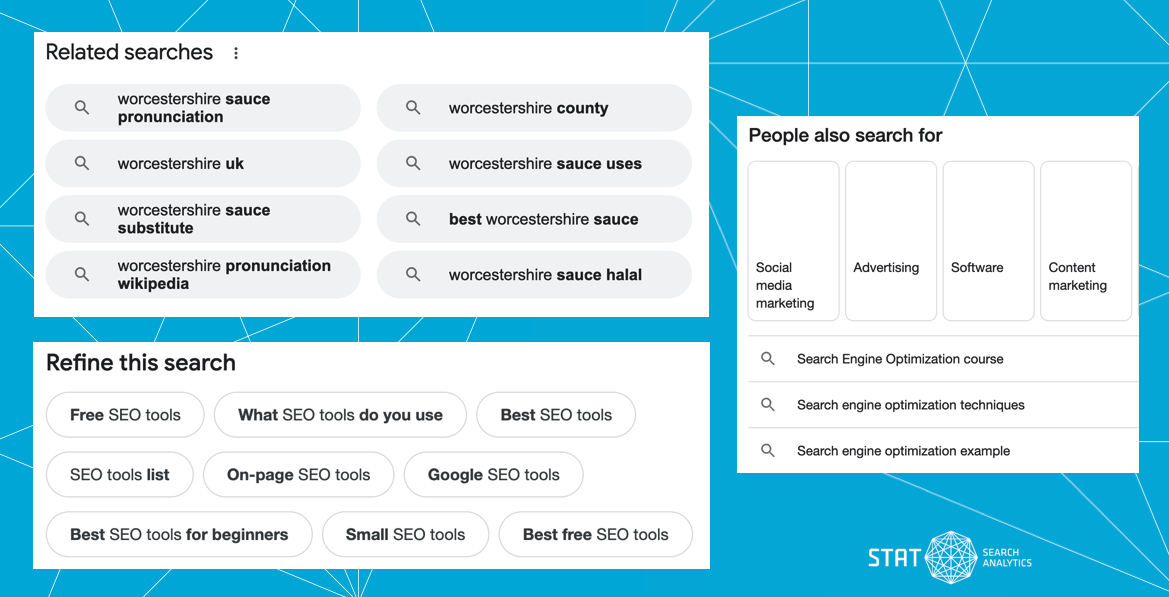
STAT tracks a few types of related searches:
- The original kind that sit at the very bottom of the SERP.
- The “People also search for,” scattered throughout the SERP, which tend to have images and a carousel-like shape.
- The “Refine this search,” which also show up throughout the SERP but look more like the original.
But no matter the format, they all behave the same: when clicked, they become the query of a whole new SERP, helping searchers either expand upon or further refine their original ask.
The many faces of related searches
This shape-shifting feature can show up in a variety of formats.
Given that the original flavour of related searches are a bottom-of-the-SERP mainstay, we weren’t surprised to see this SERP feature category take the top spot in our study. What surprised us instead, was not seeing them on more SERPs. Shouldn’t they be on pretty much every SERP outside of some of the more unique queries?
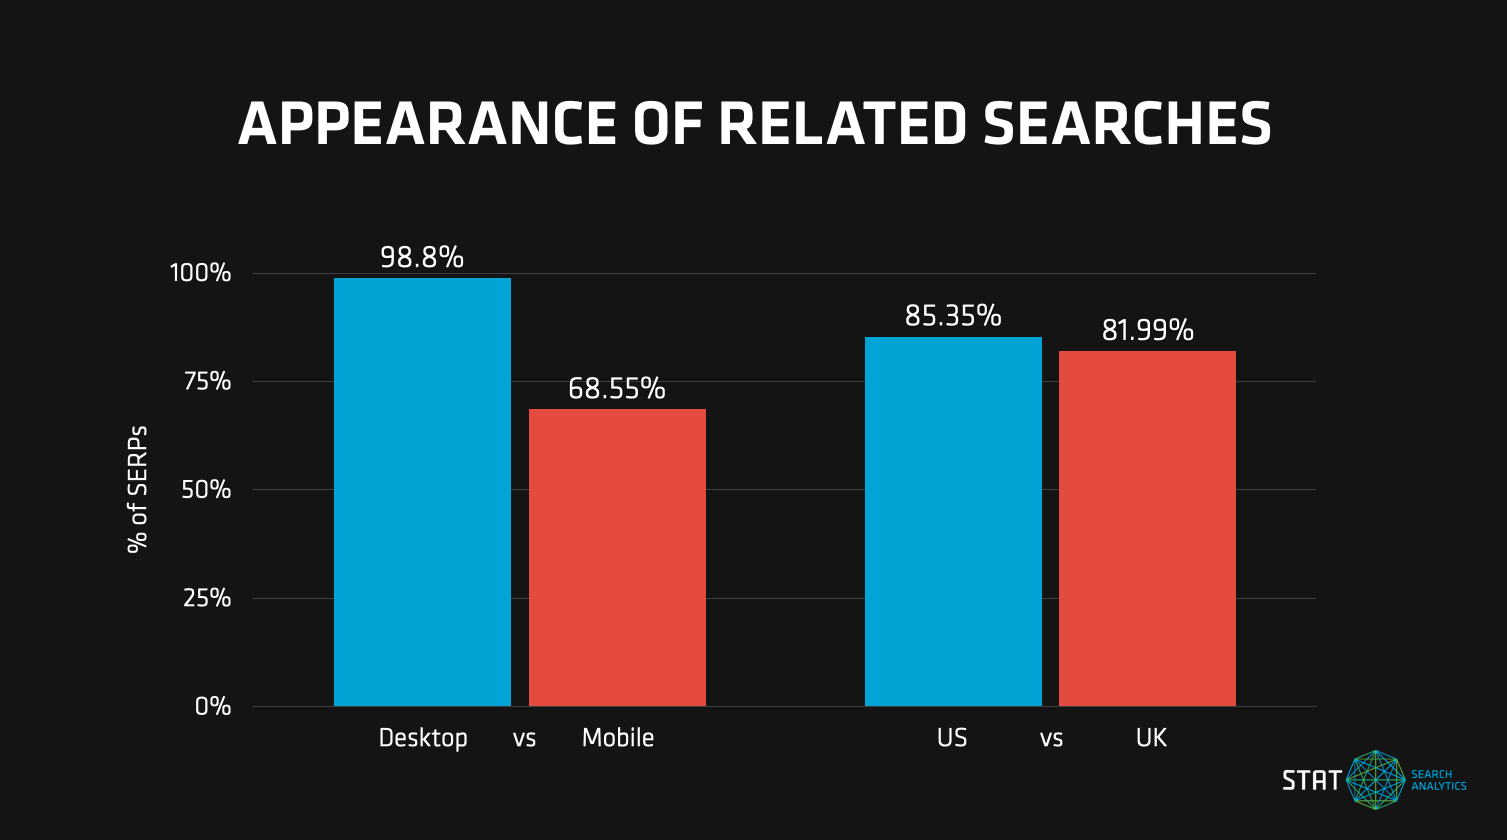
To see if we could figure out what might be going on, we looked at how related searches were appearing on different devices. On desktops, they showed up on 98.80% of our SERPs, which is about what we’d expect.
Smartphones were the other side of the story. Related searches only appeared on 68.55% of smartphone SERPs. This could be due to the continuous mobile scroll — when the SERP is infinite, there’s technically no bottom and Google may be automatically expanding or refining the query with each new load of the scroll.
Just to double check nothing else was afoot, we looked at the location split for related searches, and found that they appeared pretty evenly in the US and GB markets.
Appearance of related searches
Related searches appeared much more frequently on desktop than mobile.
Sometimes it’s hard to get excited about a SERP feature which, as much as it is ubiquitous, is also near impossible to influence. However, related searches and its cousins do present an SEO opportunity: they’re excellent sources for keyword ideation and keyword list expansion.
Nobody has a better understanding of search intent and search journeys than Google, so we’d do well to glean what they expose of that understanding.
If you want to leverage this feature and are in STAT, you can use the related searches report to pull these terms or head to our Keyword Suggestion tool, which includes related searches in its keyword corpus.
The next most commonly occurring SERP features in our top 5 are:
- The “People also ask” box on 78.85% of SERPs
- Videos on 52.84% of SERPs
- Carousels on 51.65% of SERPs
- Images on 37.81% of SERPs
Top 5 SERP features by presence
Related searches, “People also ask” boxes, videos, carousels, and images appeared more frequently than their other SERP feature friends.
Appearing most often doesn’t guarantee the biggest impact
“What are the top SERP features” seems like a simple enough question to answer but, as always in SEO, the answer is: it depends.
For example, in many cases, the most common SERP features are not always the most prominent and you’ll get a different top ranking depending on which story you want to tell. And as SEOs, the story you care most about here is impressions and acquisition — both of which are best represented by share of voice as a metric.
Presence is simply the count of SERPs on which the feature appears (here being expressed as a percentage), meanwhile share of voice is weighted by the search volume of the keyword and the ranking position of the feature, giving a more accurate representation of its visibility on the SERP.
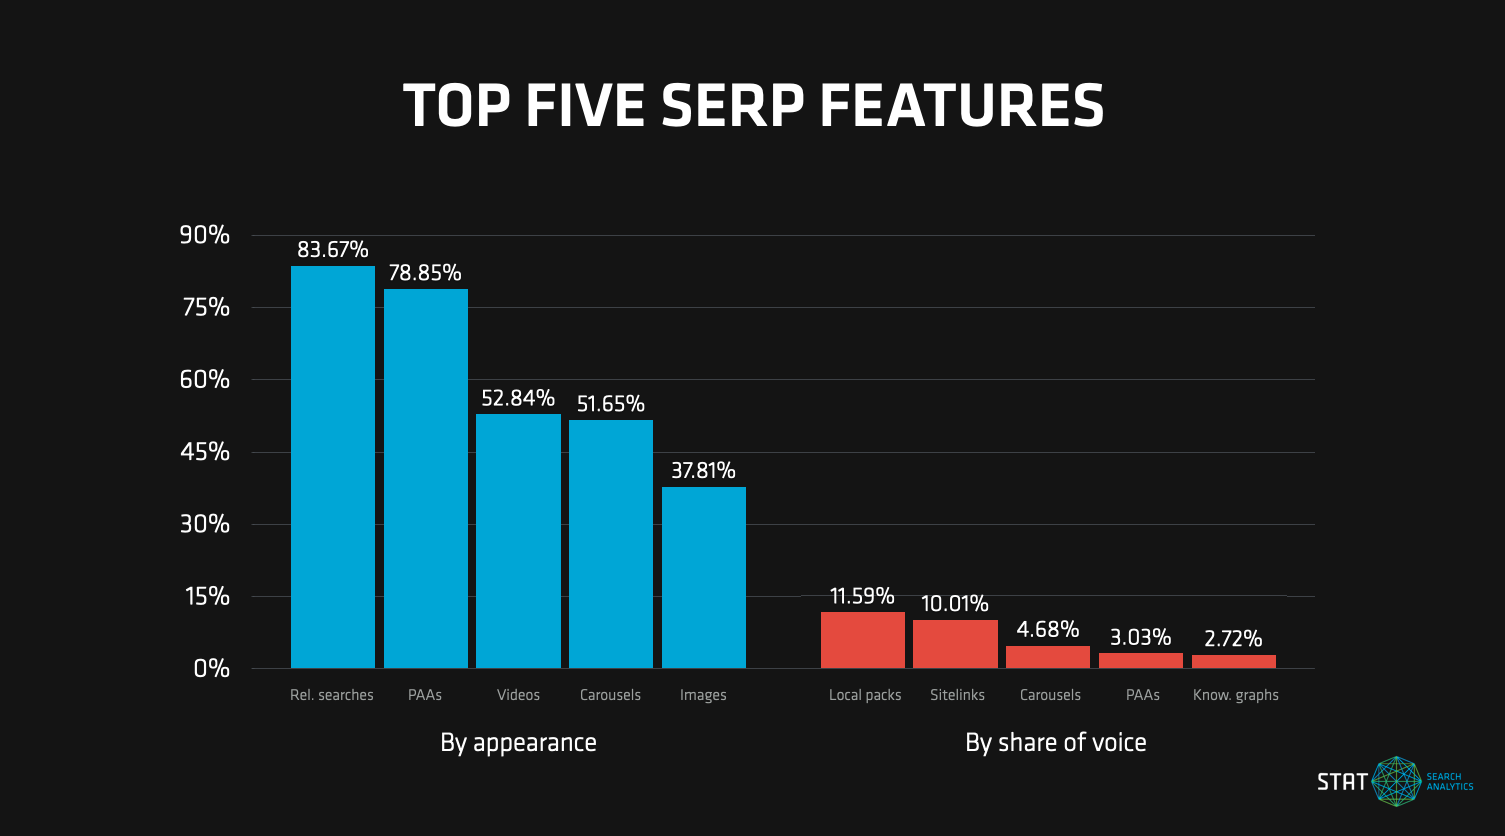
Look what happens to our top five most prominent SERP feature list when we layer in our share of voice visibility metric:
The most common SERP features
Clearly, the most frequently occurring features do not always snag the most visibility.
Related searches may be appearing on the most SERPs, but they’re driving the least visibility. They have almost no share of voice — unsurprising given their typical placement right at the bottom of page one.
So, which SERP features are going to snag you the most eyeballs?
Top SERP features by appearance and share of voice
Layering in SERP feature visibility makes this a debate of quality vs. quantity.
Local packs drive the most visibility
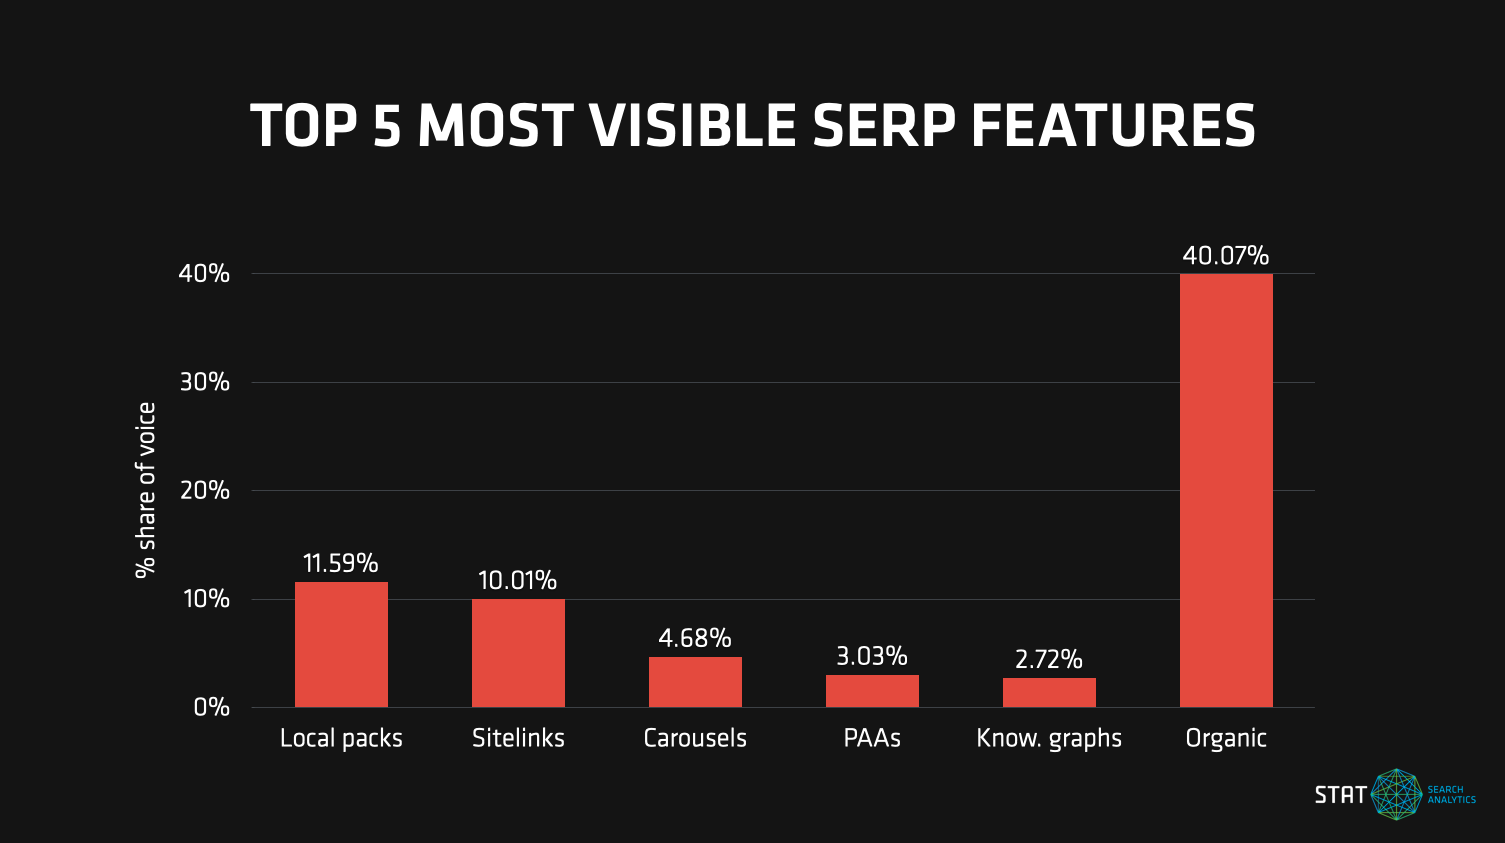
When we look at the top SERP features by share of voice, local packs take first place. Not only did this feature not appear in our top five most common list, it didn’t even make it into the top 10. This just goes to show how overwhelmingly prominent it is when it does make an appearance.
The most visible SERP features in 2023
Local packs lead the pack when it comes to securing the most visibility on the SERPs.
In fact, the most striking thing we found is that, although regular organic results (non-SERP features, included for context and comparison) have the highest share of voice by far, it’s “only” 40%. This means that the majority of a SERP’s visibility is owned by features.
The top five most visible SERP features
Since visibility is ultimately more impactful, we ranked our top 5 SERP features by share of voice. So, without further ado:
Rank 1: Local packs
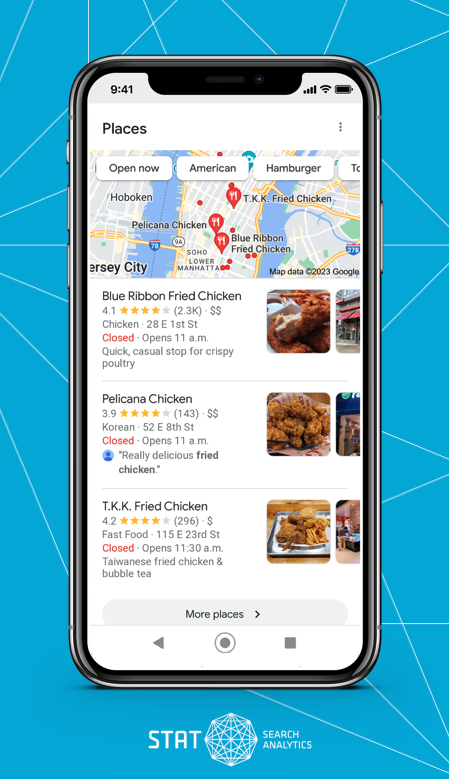
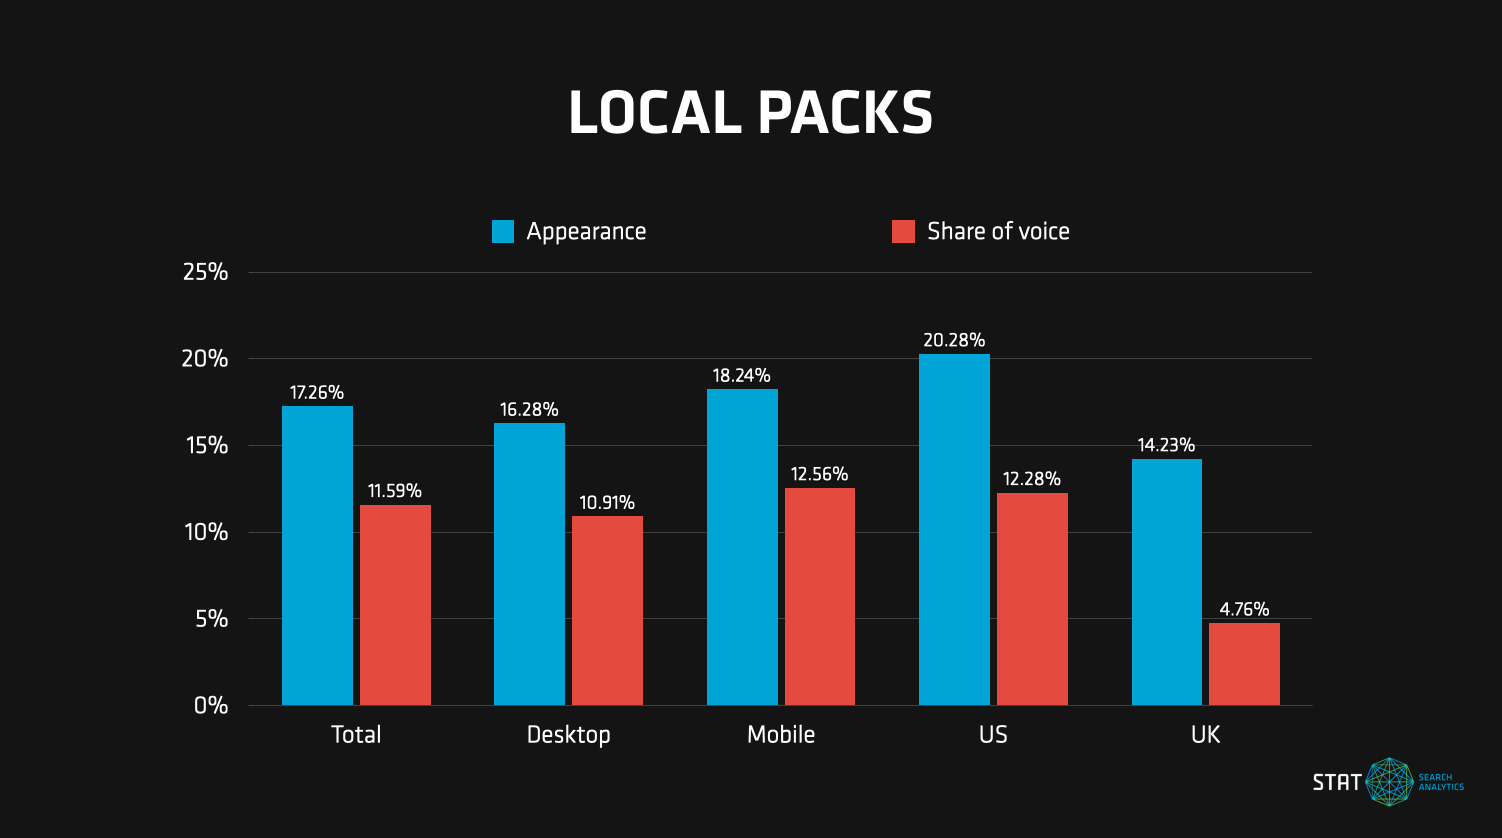
While local packs tend to dominate the SERPs they’re featured on, it’s not surprising to see them over-perform on smartphones. They showed up on 18.24% of mobile SERPs compared to 16.28% of desktop SERPs, though they drive similar share of voice.
The local pack on a mobile SERP
This smartphone-leaning feature helps users navigate their surroundings.
We expect to see this kind of smartphone performance because Google is trying to meet searchers where they are.
Not only are more searches performed on smartphones than desktop computers, but local packs are tied directly to the kinds of searches that people are performing when they’re out and about (or fixing to be out and about). Local search and local packs go hand-in-hand with mobile phones.
We also saw a fairly dramatic difference when we compared by market. Local packs skew heavily US at 12.28% share of voice compared to only 4.76% in the UK.
There’s no obvious reason for this disparity. The keyword set is mostly unbranded, but of the brands featured there is a mixture of US brands (e.g. Walmart, Kohls) and UK brands (e.g. Marks and Spencer, Nando’s). It’s not unusual to see regional disparities in Google’s algorithm in general though, so this could simply be an example of that.
Local packs by the numbers
In our primary segments, this feature skews heavily towards mobile and the US-en market by comparison.
Appearing in this SERP feature is generally within the realm of local SEO, and hinges on your Google Business Profiles, which, until recently, was known as a Google My Business Profile.
You have a decent amount of control over how your information appears in a local pack, and the more types of information you have in it — ratings, reviews, special offers, store hours, images, etc — the better. Google doesn’t always get it right though, so enlisting a listings management tool for help is never a bad idea.
If you’re in STAT and looking for local pack information, try our local pack report. It’ll tell you which keywords surface a local pack and the name of every business that appears in one, plus all available URLs on hand.
You’ll also get the position of each result in the local pack, as well as its overall ranking on the SERP. When there’s Google rating info up for grabs, you’ll have that, too. And we didn’t forget about ad listings — perfect for when you want to know if the competition is organically won or bought and paid for.
Rank 2: Sitelinks
Are sitelinks a SERP feature, a rich snippet, or neither? On the one hand, when we talk about SERP features, we don’t usually mean things that augment an existing organic search result — that’d be a rich snippet (like star ratings, or FAQs).
On the other hand, when we talk about rich snippets, we usually mean things that the site owner has more control over — by adding specific markup, supported and documented by Google with its Rich Results Test and supporting guidance.
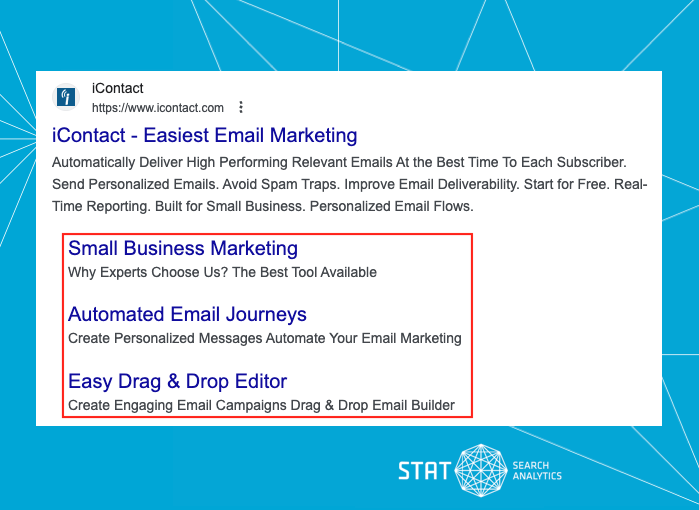
Sitelinks in the wild
It’s clear to see the expanded SERP footprint this feature provides to your results.
Site owners have very little control over sitelinks these days. Even the option to remove a URL from this list was lost from Google Search Console some time ago. Really all you can do is remove the URL from Google’s index altogether, and of course you probably don’t want to do that.
This low level of control and indirect effect on an existing organic result is reminiscent of featured snippets, which most would regard as a SERP feature — as is the large amount of SERP real estate that sitelinks consume. So, after some debate, we decided that sitelinks deserve their number two spot here, driving 10.01% share of voice.
Like local packs, sitelinks tend to be very prominent when they appear at all. This is partly because of the large amount of space they take up on the screen, but also because they typically show up for high ranking results, which Google is very confident the user is looking for – so they provide deep links.
Sitelinks by the numbers
Opposite to local packs, this feature is favored by desktop SERPs over mobile.
Also similar to local packs, there’s an expected device difference in our data. Sitelinks drive 13.41% of the share of voice on desktop SERPs, while only drawing 6.97% of the visibility on mobile devices. The reason for this is simple, desktops just have more room for these kinds of results.
Rank 3: Carousels
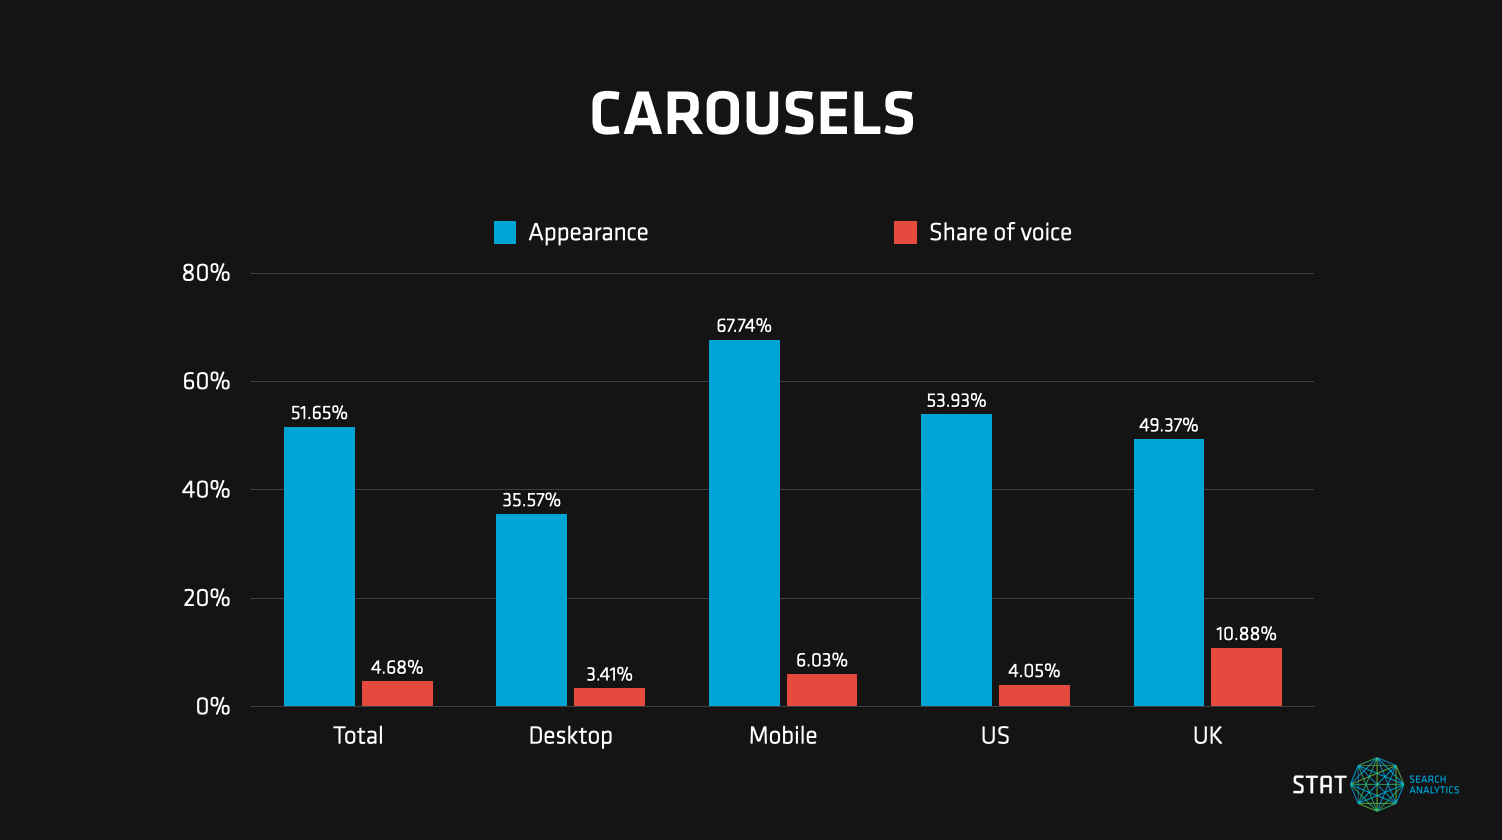
Unlike local packs and sitelinks, carousels are extremely common on the SERP, but not necessarily that prominent when they do appear, hence only making it to position three on this list, with 4.68% of the share of voice in our study.
Carousels aplenty
This tricky SERP feature comes in a wide array of shapes and sizes making it especially challenging to pin down and target.
They come in quite a few variants, including shopping, organic images (this subcategory alone won 1.57% of the share of voice), news, recipes, and “Find results on.” All of these would require different tactics to appear in, which makes this a tricky feature to target.
This variance likely explains the slightly mixed breakdown in our study. For example, this feature is more common but less prominent in the US when compared to the UK.
Carousels by the numbers
Notably, this feature occurred on fewer UK SERPs than US SERPs, but captured more than twice the amount of visibility in the UK.
Rank 4: The “People also ask” (PAA) box
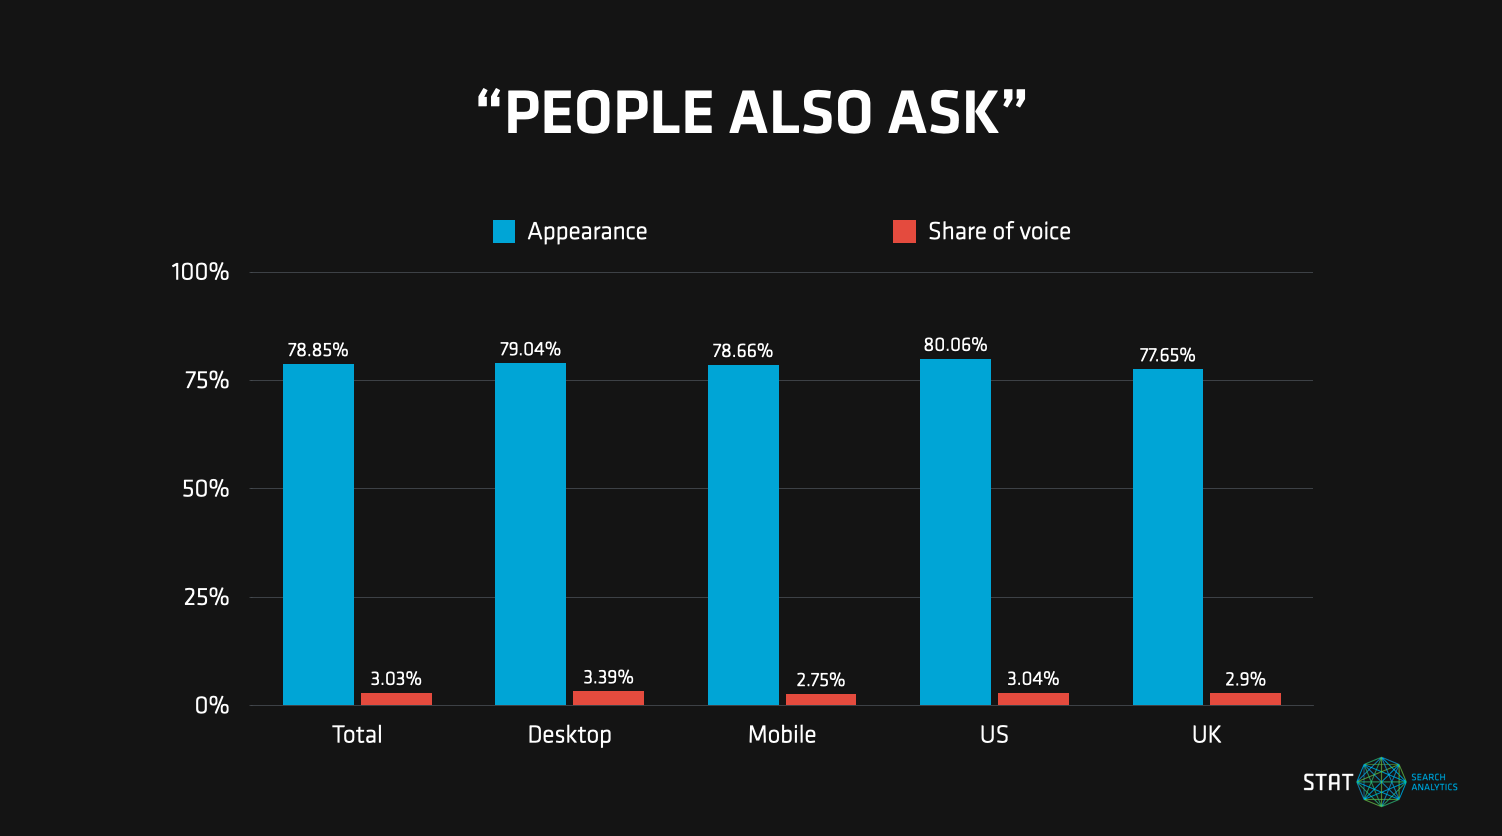
Next on our list is the incredibly ubiquitous but apparently not as visible “People also ask” box. PAAs appeared on a whopping 78.85% of our SERPs but only drove 3.03% of the share of voice.
The "People also ask" box
“People also ask” boxes can be a keyword research gold mine.
This is likely because the PAA box never ranks any higher than second place and can appear in any rank below that, including at the bottom of SERP. This is why the “People also ask” box is generally thought of more as a means of keyword research and content ideation than as a potential traffic source.
They’re technically both, but it’s not always obvious how Google selects which site to feature or whether it’s actually getting that much traffic, let alone views, given that it needs to be expanded to be seen.
For example, in our PAA above, the si.com article doesn’t even rank on the first page for [What are the best kayaks to buy?] — it only lives hidden in the box. (However, if you go so far as to expand that question and click on the “Search for” link, the featured article does become the featured snippet on the new SERP.)
The "People also ask" box by the numbers
Perhaps the most consistent of the bunch, this steady top SERP feature appears similarly across devices and markets.
When we sliced our keywords by device and market to see what else we could find, it revealed this SERP feature to be pretty balanced. It both appears similarly across devices and markets and drives essentially the same visibility across the board.
To take advantage of the content and competitive research you can do via the “People also ask” box, we just so happen to have a PAA report. For each keyword that returns a “People also ask” box, it’ll serve up the PAA questions, the URLs where the answers are sourced from, as well as where they rank within the box.
Rank 5: Knowledge graphs
Lastly, carried onto this list by overwhelming smartphone visibility, we have knowledge graphs, with a total share of voice of 2.72%.
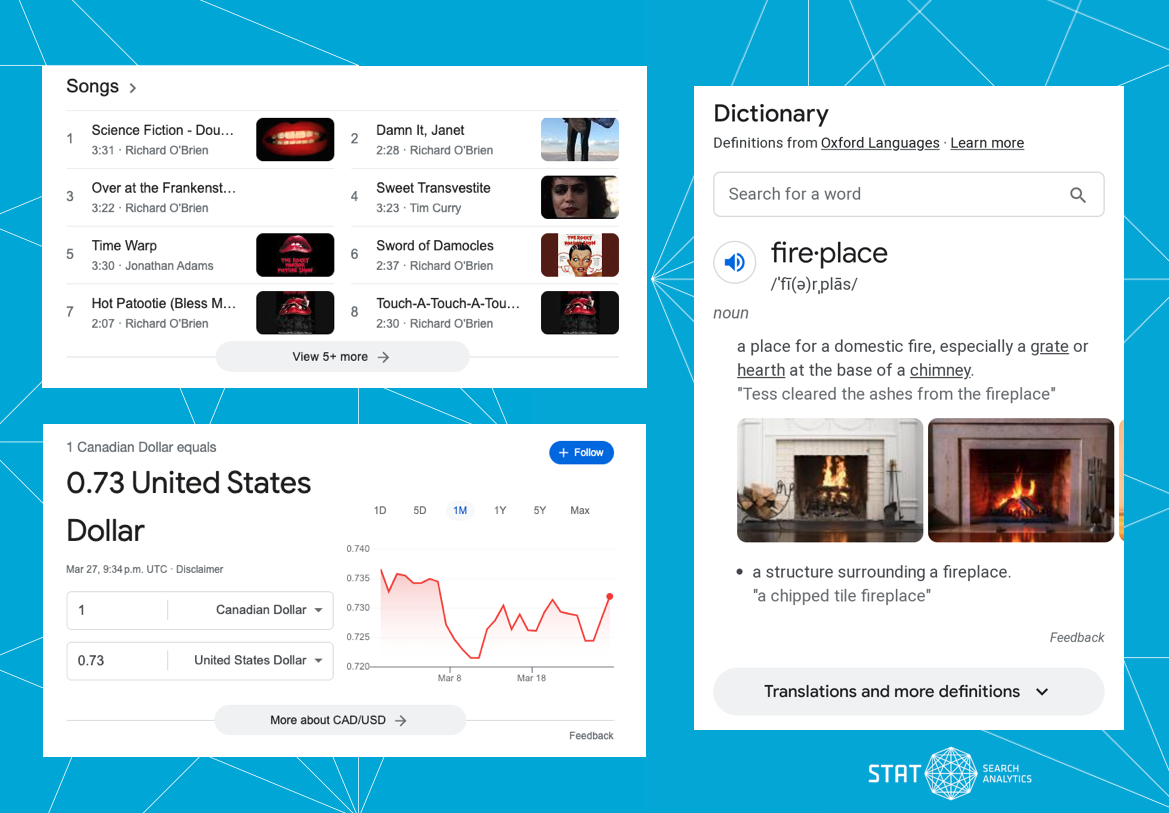
Like carousels, this feature takes a dizzying array of forms. STAT tracks a few main types, plus a catch-all “other” bucket — and that group alone drove 2.34% share of voice (ie. almost all of the entire knowledge graph category), which underscores just how much Google likes to utilize this feature to suit its purposes.
The authoritative knowledge graph SERP feature
This feature does its best to provide answers to a searcher’s query, right there on the SERP.
This feature is also generally not an opportunity. That said, many businesses do take care to ensure that Google correctly understands their brand as an entity, in case they should ever be featured in one.
For most, landing in a knowledge graph is all about establishing your business as a trusted and authoritative brand, and usually means having key elements, like a Wikipedia page in place first. Organization schema markup can’t hurt either (not to mention it can help bolster your E-E-A-T).
One potential explanation for the tremendous discrepancy in knowledge graph appearance by device — 40.46% on mobile SERPs vs. only 5.34% on desktop — is that, by design, knowledge graphs are looking to provide a concise answer to a searcher’s query on the SERP itself.
Since mobile searchers are more likely to be on the go with less time to investigate further, Google could be favoring a “quick answer” result for mobile users.
Knowledge graphs by the numbers
When it comes to knowledge graphs, the discrepancy between mobile and desktop is undeniable.
Top takeaways: local SEO, images, and change
Phew! While we always enjoy a deep dive into the data, it’s good to take a step back from the nuance and granularity of these comparisons and pull out our biggest takeaways — and it turns out there are a few.
Remember the local searcher
The most visible feature in our study is also the easiest to leverage. If you’re a business with physical premises, get out there and do some local SEO. And remember that local searches and local packs are not only relevant to in-person visits — it’s just as likely someone is looking to buy or find services locally online.
If you’re not a business with a physical location, consider carefully whether you want to play on the kind of SERPs that trigger a local pack and other location-focussed results — because these tend to dominate where they exist.
Up your image game
Images as a feature in their own right ranked fifth by presence, and eighth by share of voice, and many of our listed features also leverage images. Image carousels, “People also search for” related searches, knowledge graph results, local search listings, and many more will pull in images.
Since the SERPs are becoming a very visual place, having professional images related to your business and its offerings and featuring them — in a good format, with good alt text, in a meaningful context — on your website and other profiles can go a long way.
Expect upcoming change
Expect this picture to get more complex with time. Google has teased Bard, and the screenshots they’ve shared show an initial chat response embedded into a conventional SERP, not unlike a featured snippet. This will change user behaviour on those SERPs dramatically, and we’ll be looking to integrate chatbot responses into our ranking and share of voice models.
Meanwhile, advances in AI tools have highlighted web search’s weakness in quick, simple answers, so you can expect to see Google pushing even harder on knowledge graph results that show an unsourced answer directly in the SERP — like you see now for things like currency conversion, or [what time is it in (city)].
We’ll repeat this study next year and our bet is on a different picture than the one we’ve reported here.
Which SERP features are most visible in your keyword space?
Now that we’ve explored which features are dominating the broader SERP landscape, you may be thinking that you’d like to zoom in on what’s happening for your own specific industry and keyword set.
We’ve outlined five steps to surfacing a SERP feature strategy so you can do just that. And, if you’re interested in taking STAT for a spin, say hi — we’d love to show you around.
