STAT founder Rob Bucci on a new way to see and understand your keyword rankings by tag.
Today, I’m excited to talk about how STAT now gives you the power to chart the distribution of your keyword rankings on the SERP.
This is very useful information that can give insight into where you’re making gains and where you’re losing ground. This information can illustrate the impact of an algorithm shift, and even help pinpoint where you should be deploying your resources.
(I should mention that you can try out the ranking distributions for free on the STAT Codex. If you haven’t seen the Codex before, take a look! It’s a great source of unbiased ranking benchmarks across a variety of industries.)
I could write a long-winded essay about why it’s great to know how your keyword rankings are distributed, but a picture is worth a thousand words, right? Right!
So, let’s take a look at a real-world example of how useful this info is. Here is a screengrab of the distribution chart for keywords tagged with “attorney” tracked against Yellowpages.com:
Ranking distribution for Yellowpages.com
The STAT Codex shows SERP distributions for all keywords tagged with ‘attorney.’
As you can see, this chart makes it easy to see where your rankings are most densely concentrated on the SERP between 0 to 100. We also overlay a line graph that indicates your average ranking (in this case, we’re looking at the Google SERP).
In the example above, we’re able to deduce that a rise in the average Google rank on August 25, 2012 occurred because 49 keywords lost their top-ten rankings.
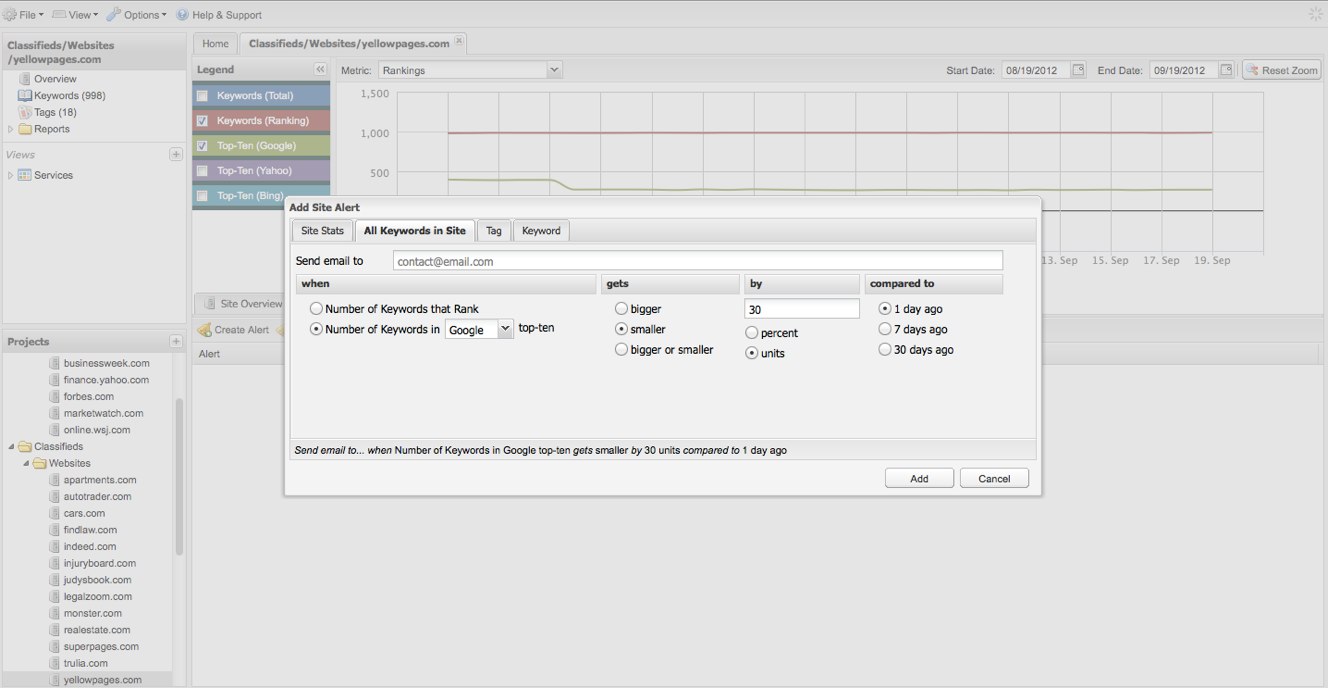
As a side note, if we create an alert to monitor shifts like this, STAT can automatically notify us when and where it happens.
Custom alerting
Creating an automated alert. In this case, it’s for top-ten Google rankings.
Here, I’m telling STAT to send me an email if my site loses 30 or more top-ten rankings over a 24-hour period. If that ever happens, there is clearly something going on that I need to take a closer look at.
To see ranking distributions, click on Tags in the site navigation panel and select a tag from the table. Once you’ve selected your tag, you’ll be able to open the Ranking Distribution subtab below.
We strongly recommend that analysts take full advantage of tags and tag views in order to achieve more granular insight into their keyword sets. You can learn more about tags and tag views by visiting our help desk.
Cheers,
Rob


