We analyzed this SERP mainstay across multiple markets, device types, and days to see how much it’s changed over the years.
We recently shared how “People also ask” boxes (PAAs) remain one of the most common Google SERP features. They also remain invaluable for SEOs looking for top of funnel keyword ideas or analyzing keyword intent. So, it’s time for an updated deeper dive — what’s the current state of PAAs?
We’ll break down overall presence, distribution by organic rankings, how many PAAs are re-used between different keywords, what types of question keywords are most likely to feature a PAA on their SERP, and more. Let’s get into it!
Methodology
As with our other recent studies, this analysis uses the MozCast keyword corpus, as tracked in STAT — so 10,000 head terms, tracked in the US and UK markets, across both desktop and mobile device types. We used a seven-day sample — the last full week in April (23rd–29th), 2023 — so including the device and country combinations, this made for 280,000 total SERPs.
We also took a trip back to 2016 and 2017 via the STAT research time travel machine and dug up some PAA research of old, to compare with our recent findings. While the datasets differ for each study, we still thought it would be interesting to see what’s changed on the PAA front over the years.
What is a “People also ask” box?
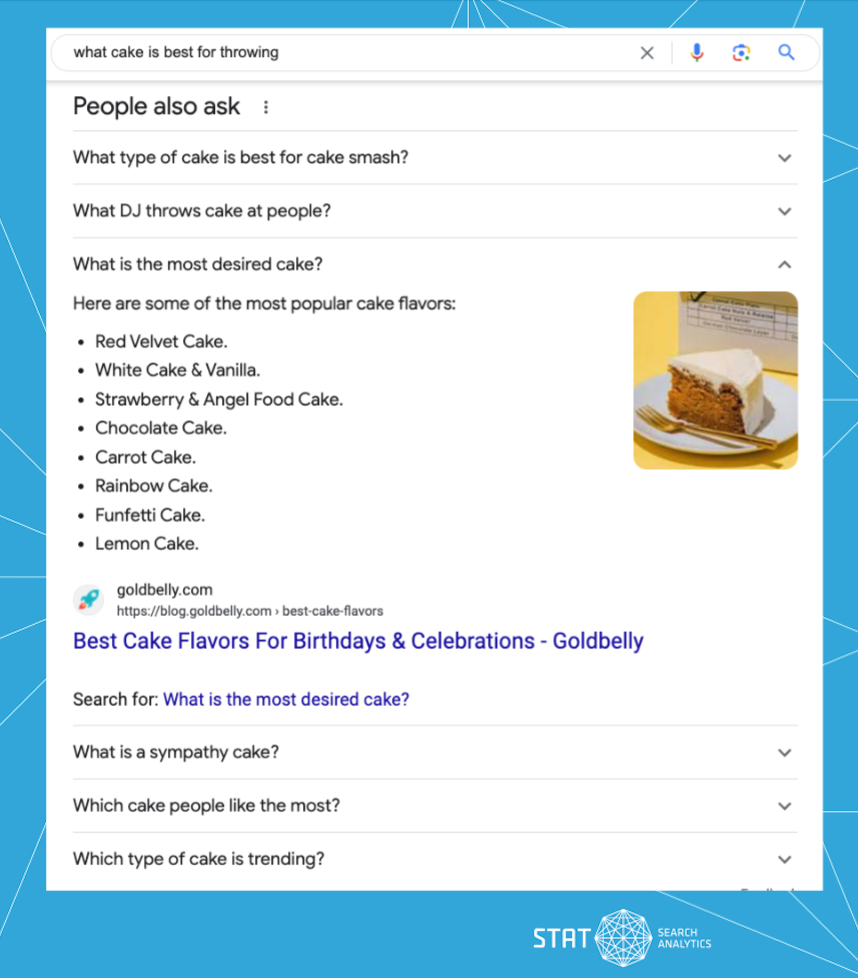
PAAs are an often overlooked SERP feature, lacking the immediate visual prominence of a featured snippet or local pack. The PAA box contains a bunch of related search terms which can be expanded to see a snippet and a suggested website, and a link to search for the follow-up term.
Given the increasing prominence over time of this feature (as we’ll see below), Google presumably considers the PAA a great way to handle keyword ambiguity and keep searchers within their ecosystem.
A PAA box in the wild
When expanded PAAs can take up loads of valuable real estate on the SERP.
For SEOs, the PAA represents a double opportunity. Firstly, for keyword research and suggestions. (Indeed, PAAs are one of the data sources used in our Keyword Suggestions feature.) Secondly, you can of course hope to rank in the PAA — although this can be a little tricky to optimize for as the results shown are often not the featured snippet or top ranking URL for that query.
How frequently do PAAs appear?
First, we took a look at PAA appearance. We simply measured what percentage of our SERPs contained any occurrence of a PAA box to see if we could uncover any nuance by market or device.
Overall prevalence of PAAs
These days, PAAs are more prevalent than ever, now appearing on over 80% of our SERPs. When compared with our earlier findings, they started small, saw a huge increase in five months from 2016 to 2017, and in the convening years they’ve taken over more SERPs than ever.
PAAs have grown in prevalence
When compared with our previous studies, it looks like PAAs are popping up more and more over time.
Prevalence of PAAs by device type
PAAs are largely consistent (and consistently high) across device type in our latest dataset. While our sample size was much smaller in scope at the time, this is in line with our earlier research, which also saw PAAs occur at almost the same frequency across mobile and desktop SERPs.
Prevalence of PAAs by device type
Over time, we have never seen a great discrepancy in PAA prevalence by device type.
Prevalence of PAAs by market
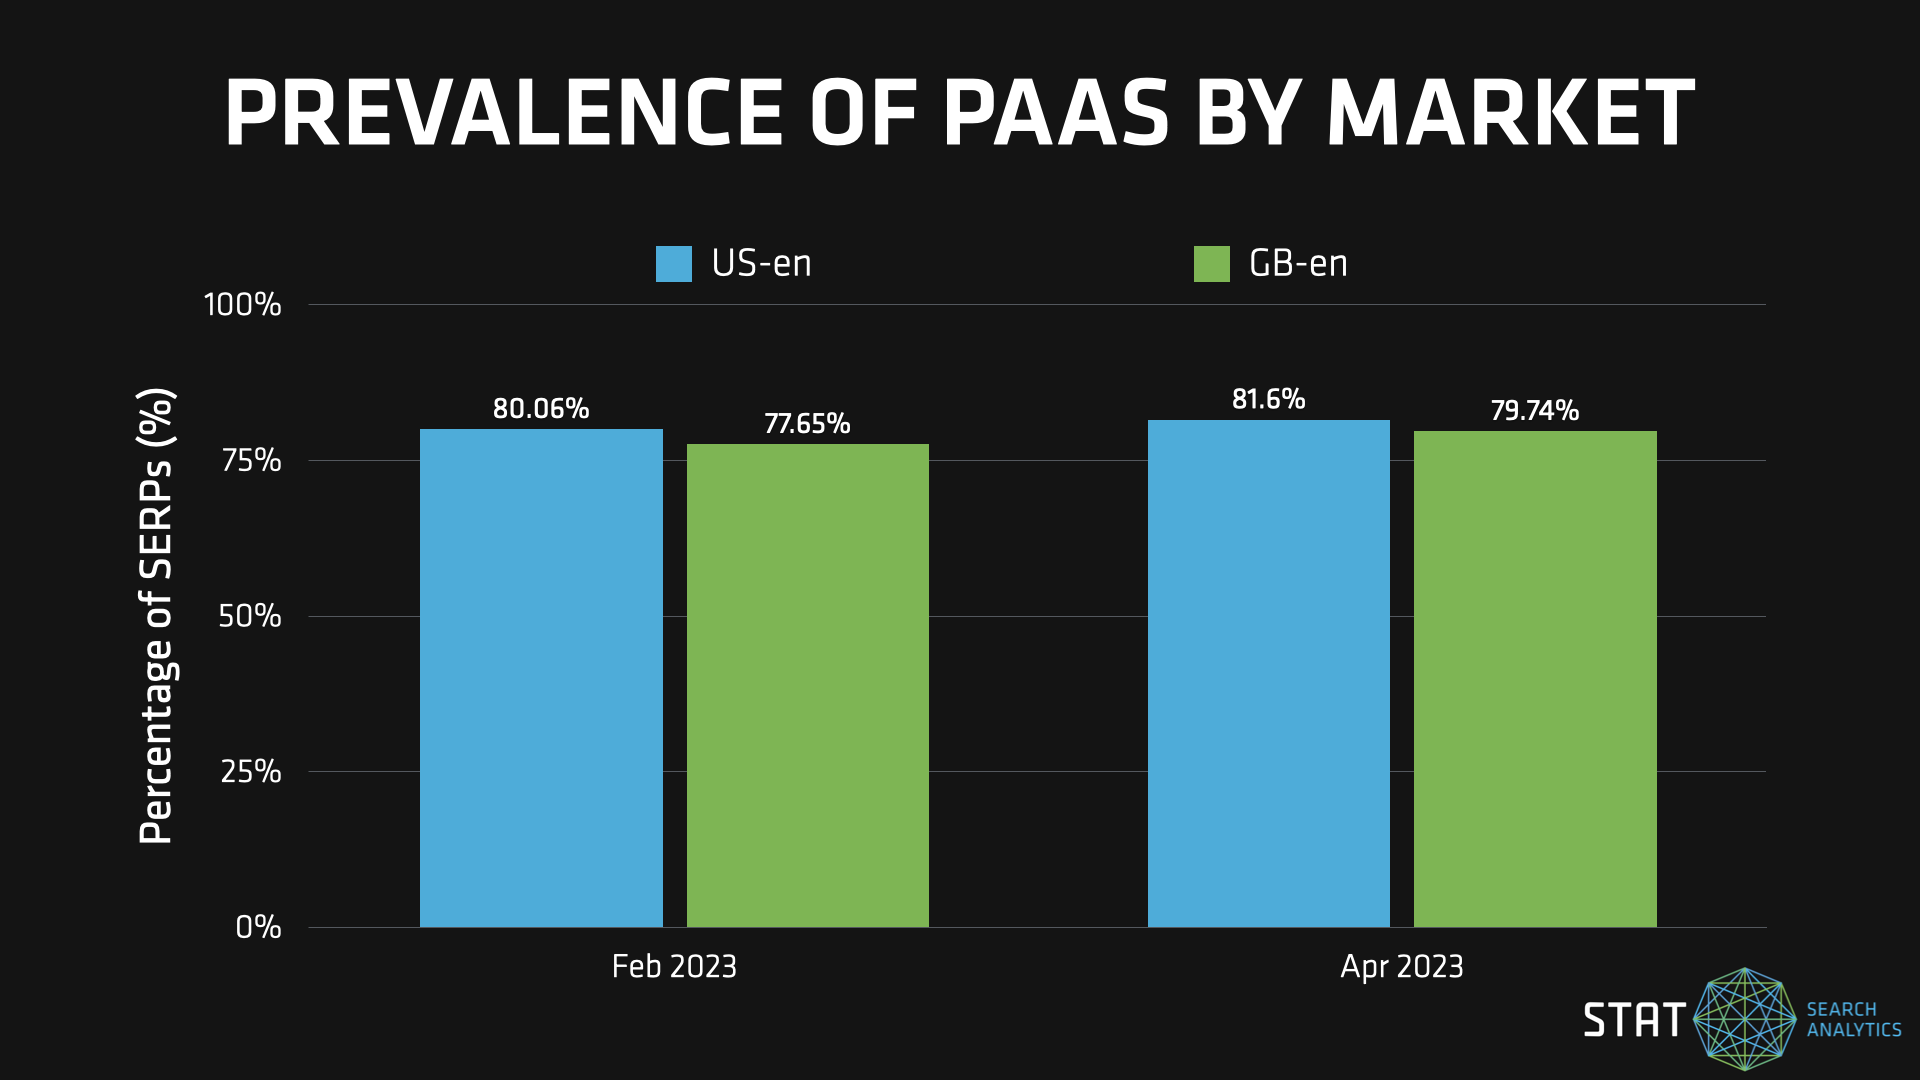
While we only have a breakdown by market for our 2023 findings, prevalence here is quite similar across markets, with perhaps a slight leaning towards the US.
Prevalence of PAAs by market
There was again a very small degree of variance in terms of prevalence by market, with perhaps a slight preference towards the US.
Where are PAAs appearing on the SERP?
Next we took a look at the distribution of PAAs by organic ranking. Upon close inspection, we did notice some variation in terms of where they appear within their SERPs.
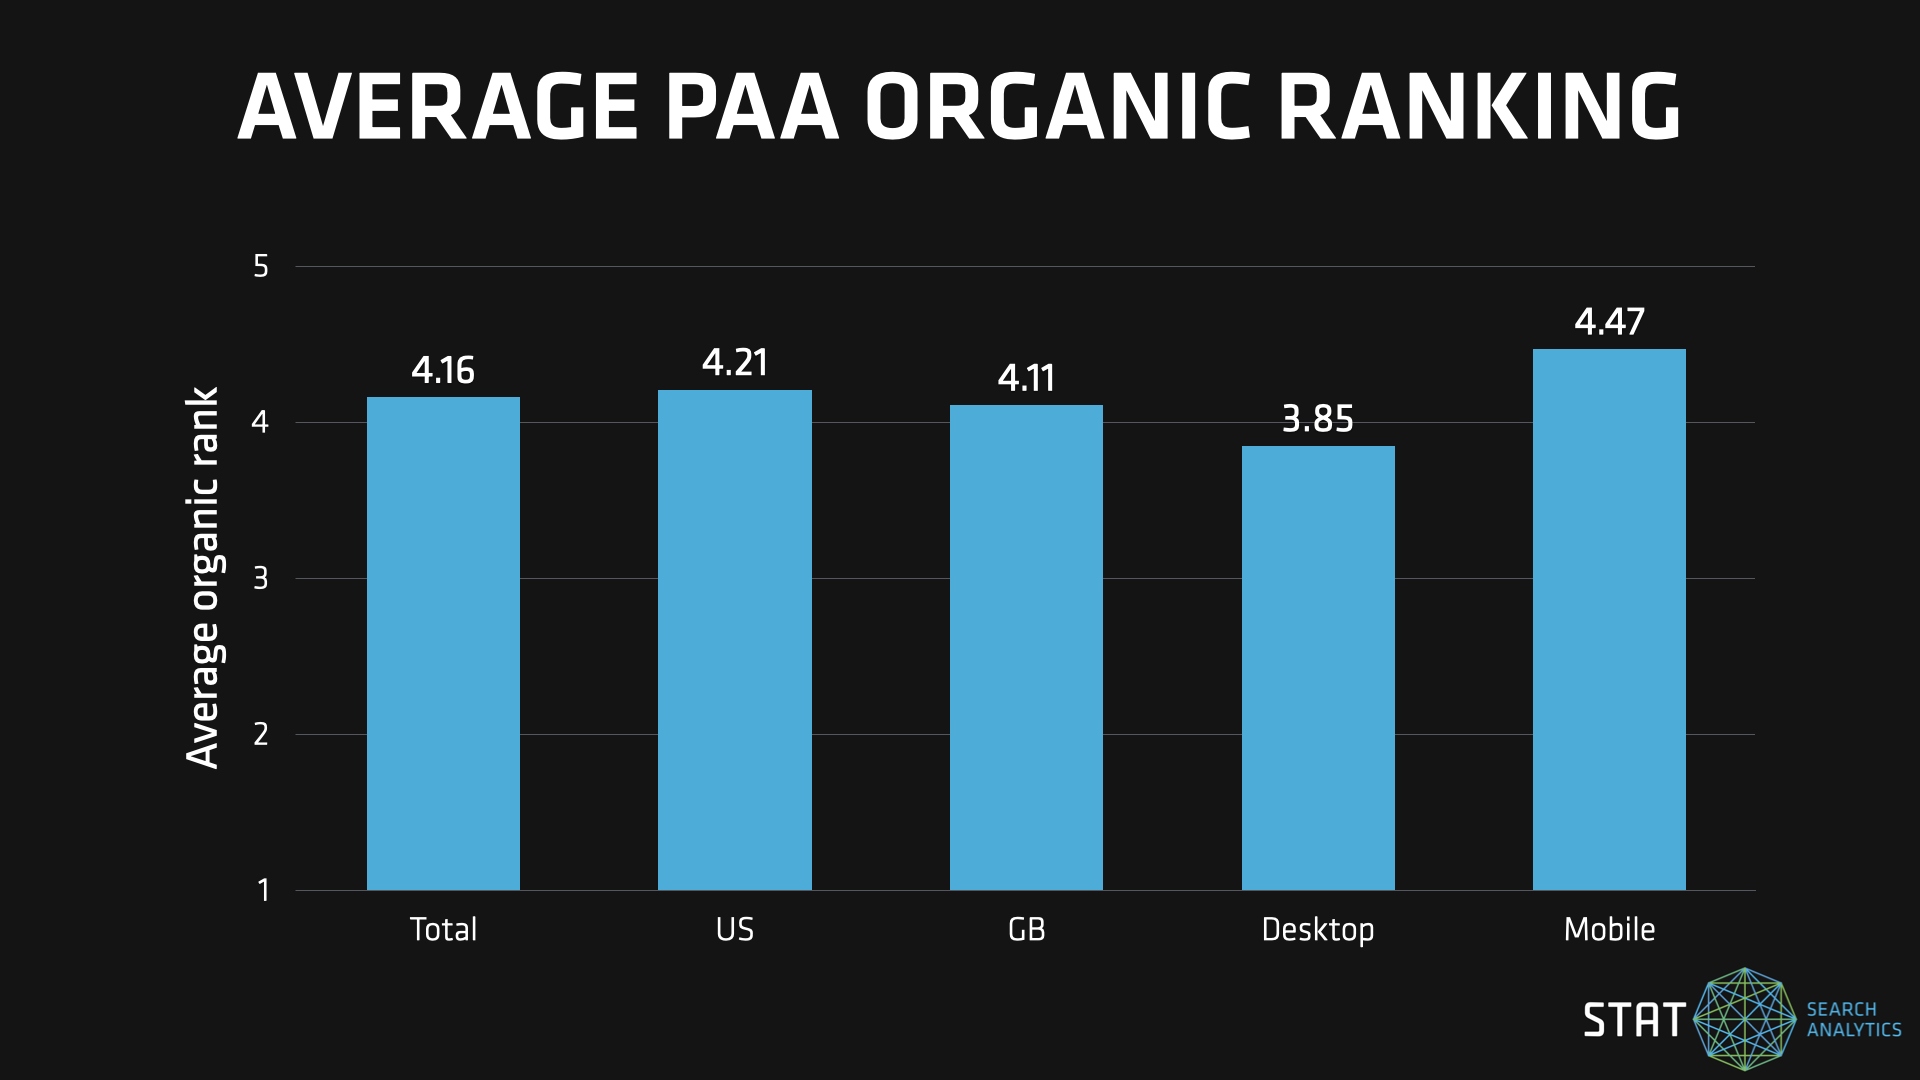
PAA average rank by segment
When looking at average PAA rank, there was a slight variance, with PAAs appearing further down the SERP on mobile devices.
We found that mobile PAAs have a noticeably lower average rank — that is to say, they’re typically appearing a bit further down the SERP than their desktop counterparts.
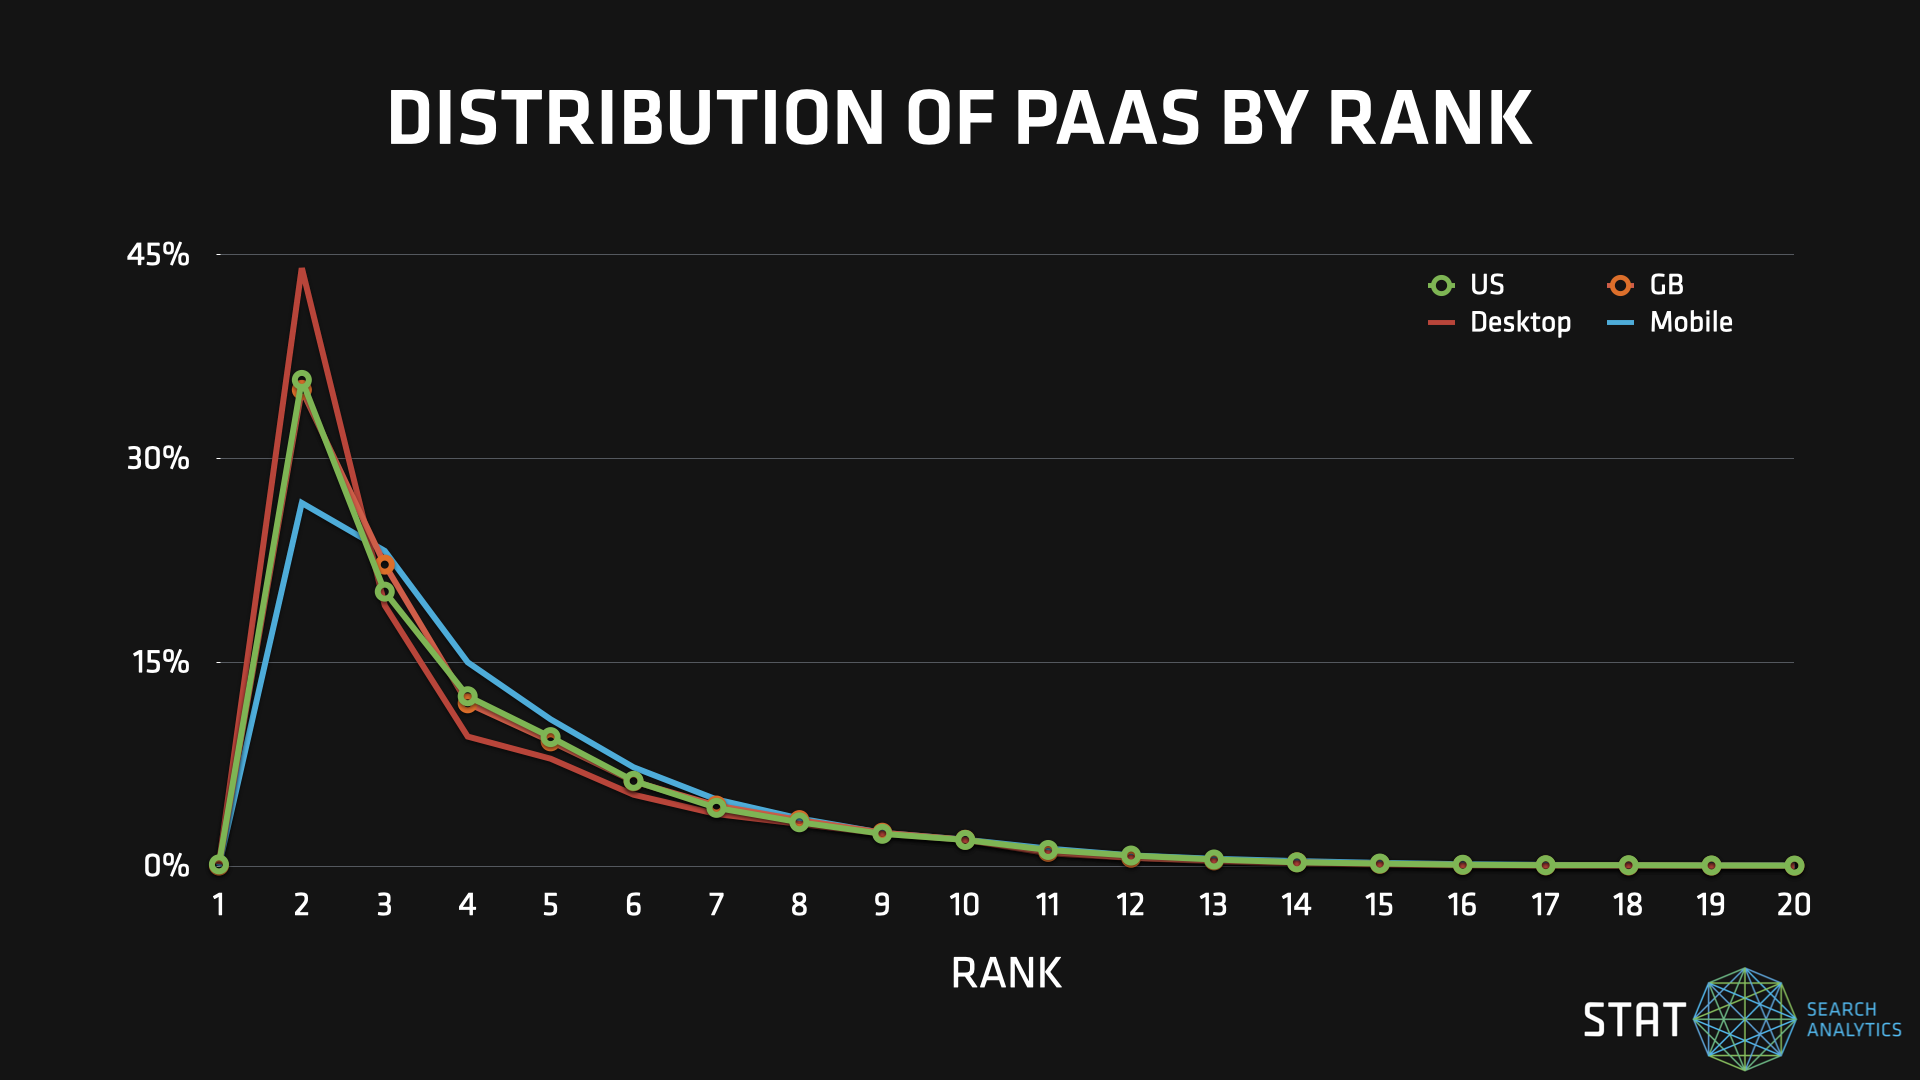
This piqued our interest so we wanted to zoom in even closer and break out the distribution of PAA occurrence across the top 20 organic ranking positions.
The distribution of PAAs by rank
Distribution of PAAs by rank showed the biggest variance by device type while they were distributed almost identically across markets.
Gone are the days when PAAs were highly concentrated at the bottom of page one. When we took our first in-depth look at PAAs back in 2016, we saw 22% of them appearing in position 10 (keeping in mind a very different keyword sample size).
Instead, now we see a sharp spike around position two on desktop, with smartphone results seeing more of a balance between positions two and three.
The questions that trigger PAAs and those within
After looking at where these popular SERP mainstays were appearing, we decided we wanted to examine the content appearing within them more closely.
What types of questions are featured in PAAs?
To start off, we took a look back to 2016 where we explored which question words (who, what, where, when, why, etc.) were featured in the most PAA boxes.
| Question marker | Percentage |
| Are | 3.9% |
| Can | 1.6% |
| Do | 2.7% |
| How | 18.8% |
| Is | 11.8% |
| What | 51% |
| When | 1.6% |
| Where | 2% |
| Who | 1.6% |
| Why | 5.1% |
Back in the day we ran a study analyzing which question words were featured most frequently in PAAs — “what”, “how”, and “is” were the frontrunners.
While our data set here is different, we wanted to see how our 2023 findings compared.
2023 PAA research coming in hot
We found that “what” is still appearing as the first word in PAAs far more frequently than its contenders.
Just a little bit of history repeating. Just like Shirley Bassey sang, we’re having deja vu with another crushing victory for team “what” here, mirroring what we saw in our 2016 study.
Although we suspect this could vary significantly depending on your keyword set, with “how” and “is” bringing up a commanding second and third place finish again, we can’t help but think that the more things change, the more they stay the same.
What types of keywords produce PAAs?
On the flip side of the PAA coin, we wanted to take a look at the breakdown of question words at the beginning of the keywords that triggered PAAs.
These findings are a little slimmer as we’ve removed words with a low sample size of SERPs. In what’s left though, we can see that some question terms have a well above average chance of spawning a PAA, but there was less of a dominant winner in this category.
A breakdown of which keywords triggered PAAs most frequently
When it comes to the keywords triggering PAAs, there wasn’t as clear of a front-runner in terms of the most common first word.
How predictable are PAAs?
Next we wanted to take a look at whether or not the PAAs for our keywords would show any volatility in terms of the content pulled into them. To do this, we dug into the actual PAA questions and surfaced the URLs across them for our seven day time period.
Unique questions within our PAAs
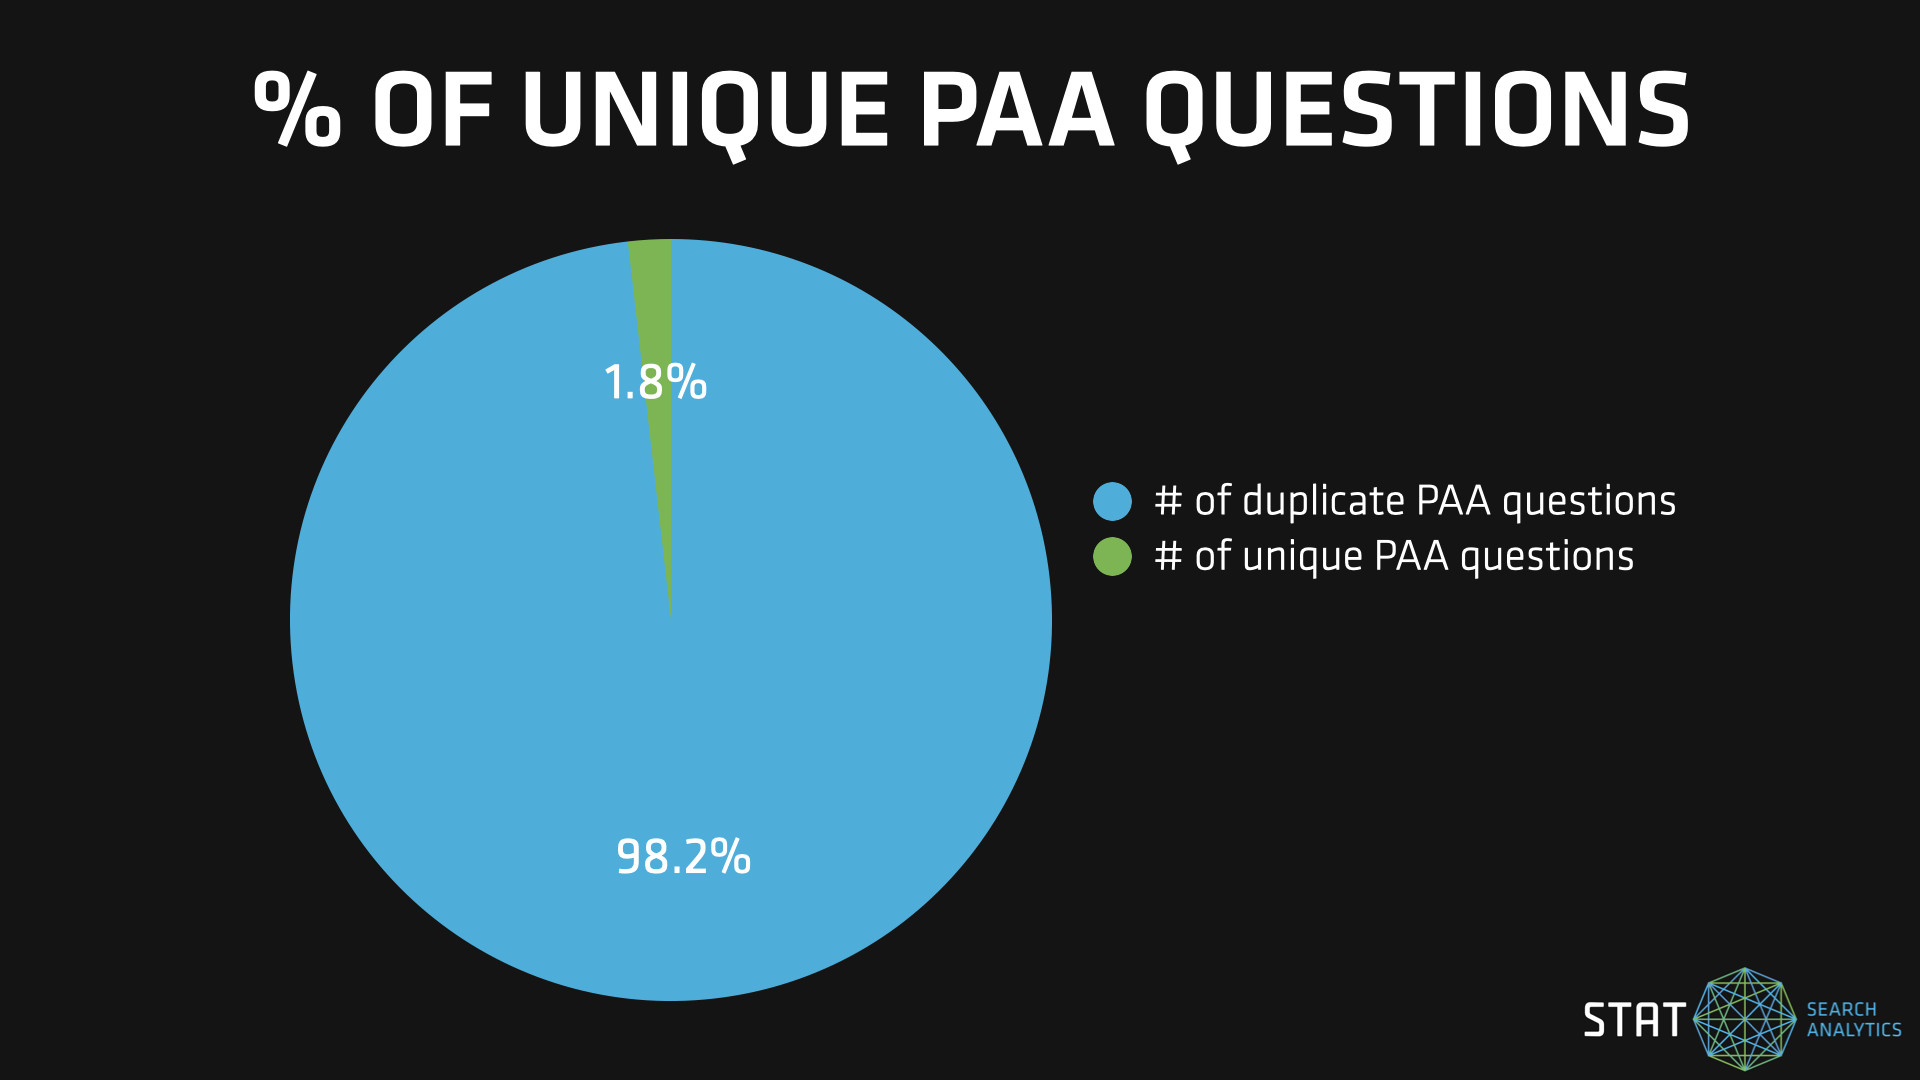
There were very few unique questions in our data set — a mere 1.8% of our questions appeared only one time. This, however, is to be expected when you consider that our massive pool of PAA questions comes from a set of keywords repeated across seven days, two markets, and two device types. If anything, it’s staggering that there were any unique questions at all.
That's one small slice of pie
While you could expect to see the vast majority of questions repeated 28 times, we found that for 1.8% of our PAA questions that wasn’t the case.
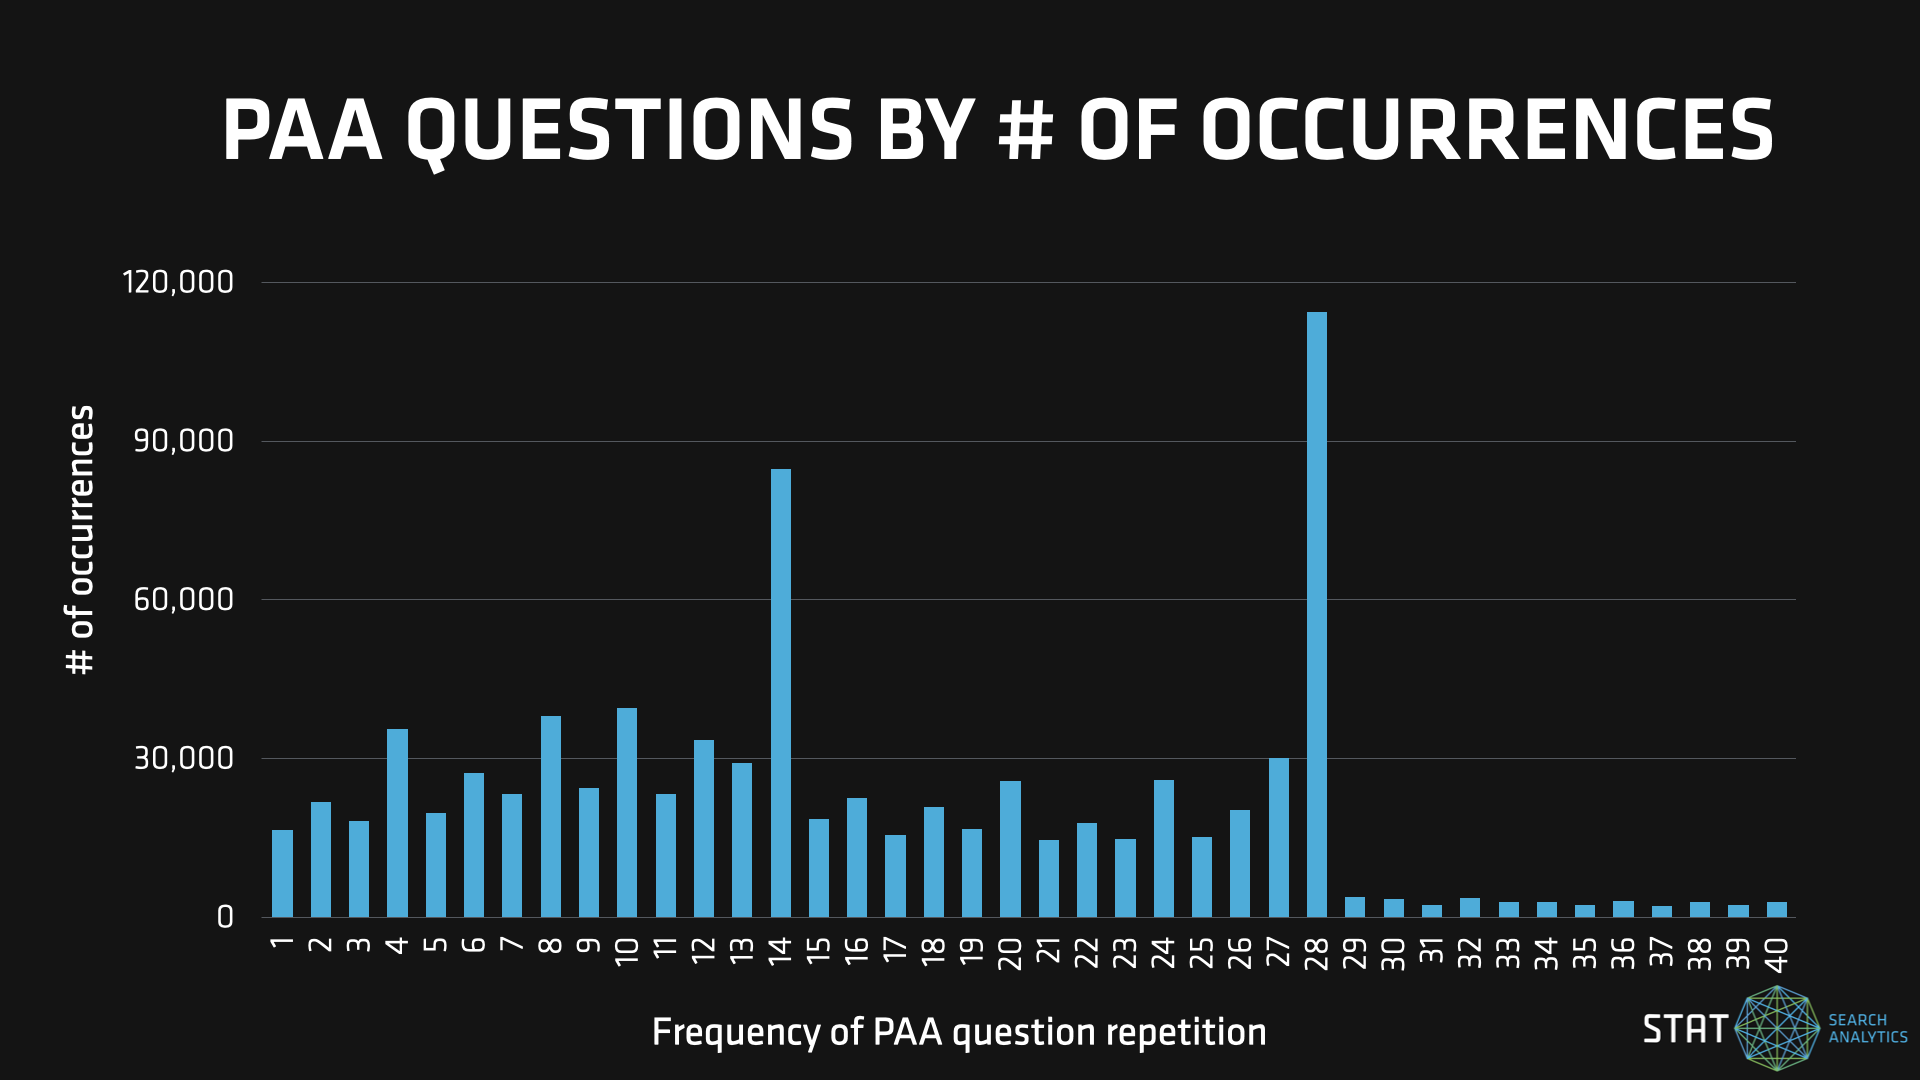
Of course, just because there are very few unique questions, it doesn’t mean that PAA questions occur at the same rates, even if they’re duplicating. You’d probably expect to see most questions repeated 28 times (7*2*2) and, indeed, there is a concentration around 28 occurrences, however, this accounts for fewer than 13% of our total questions.
PAA questions by frequency of occurrence
While the highest concentration was at 28 occurrences, there was more variance here than you might first guess.
It turns out that while the vast majority of our PAA questions may repeat, the amount of times they do so is highly variable. So in this sense, the questions within PAAs are really not that predictable at all.
When we pulled the top 10 questions by number of appearances, though, we learned something else about PAA predictability:
| PAA Question | PAA URL | Question count |
| Is Galaxy S3 still good? | https://www.youtube.com/watch?v=KpYWyXhFjKc | 243 |
| What is the 5 gift rule for Christmas? | https://justplanbooks.co.uk/what-is-the-5-gift-rule-for-christmas/ | 189 |
| Is it ok to wear jeans to ruth chris? | https://www.tripadvisor.com/FAQ_Answers-g155019-d708598-t1163310-What_is_the_Dress_code_for_Ruth_s_Chris_We.html | 188 |
| What’s a good lazy dinner? | https://www.thelazydish.com/lazy-dinner-ideas-for-busy-moms-and-dads/ | 168 |
| Do HTC phones still exist? | https://www.gadgets360.com/mobiles/htc-phones | 166 |
| How can I lookup a phone number for free? | https://www.wtkr.com/brand-spotlight/10-best-completely-free-reverse-phone-number-lookup-sites | 159 |
| What is a thoughtful gift? | https://www.collinsdictionary.com/us/dictionary/english/thoughtful-gift | 154 |
| Can I find out who a phone number belongs to? | https://electronics.howstuffworks.com/reverse-phone-lookup.htm | 150 |
| What symptoms do you have at 1 week pregnant? | https://www.medicalnewstoday.com/articles/pregnancy-symptoms-week-1 | 142 |
| How can I lookup a person for free? | https://best.lovetoknow.com/Best_Free_People_Finder | 141 |
Looking at the ranking URLs attached to each question, the link shown was entirely consistent for these PAAs, even across their hundreds of occurrences — the only variation being the occasional appearance of anchor links and m.youtube for the Youtube result. So, in the URL sense, PAAs were extremely predictable.
Also interesting was that some of these keywords have near zero search volume. We saw this in our first study back in 2016, and it’s still the case today. Google is not necessarily showing popular queries here.
And while we don’t know the exact determining factors behind which or why PAA questions will differ for the same keyword, it goes to show that if you’re able to snag coveted space in this prolific SERP feature, that you’ll most likely be getting exposure on multiple SERPs.
PAA questions that only surfaced on one device type
Probably the most popular use case for PAAs among SEOs is as a prime source for top of funnel keyword research. Of the ~23,000 unique questions we saw in this study, around 6,500 (or 28%) only ever appeared on one device.
It didn’t seem like there was much rhyme or reason to this as the keywords themselves did not have mobile-specific intents. It’s most likely that there’s just a lot of variance and unpredictability when it comes to long tail keywords. Nonetheless, if you want to ensure thorough coverage of PAA questions, you’ll want to make sure you’re tracking keywords on both device types.
What’s next for PAAs?
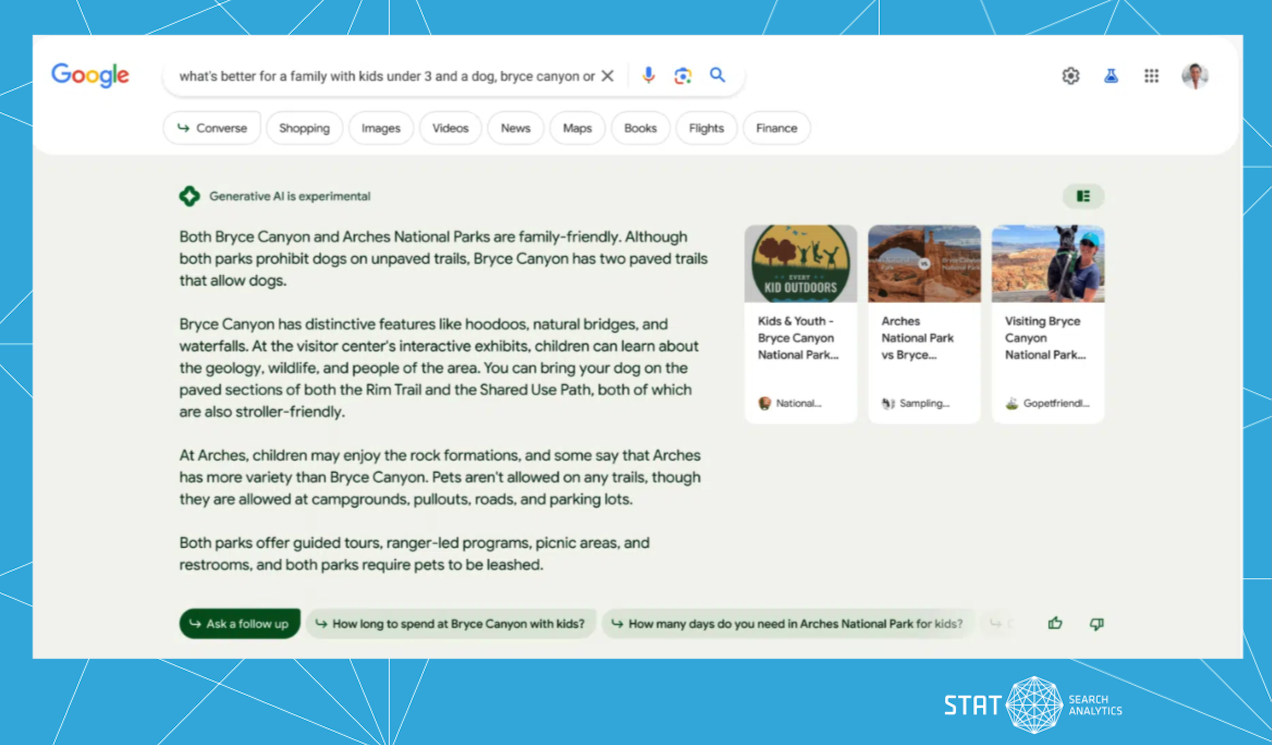
All the buzz in the STAT Slack as we write this is around Google’s new “Search Generative Experience,” shown off recently at Google I/O. Here’s an example of one of their mock-ups:
Times they are a-changin'
Hot off the presses, Google’s Search Generative Experience was just announced at Google I/O.
Here we can see a couple of very PAA-like questions at the bottom. It’s not clear at this time whether these are AI generated or part of the old PAA system, or something in between; or indeed whether they’ll totally replace PAAs on the SERPs where they appear. Of course, we’ll be collecting this data (and much more) as soon as these results start appearing out in the wild. Stay tuned!
So, what have we learned?
Time flies when you’re tracking SERPs. And in a world where AI innovation in search is upon us and this space will undoubtedly change, it’s comforting to know that some things remain the same as the good ol’ days.
After dissecting 280,000 SERPs we learned:
- PAAs are even more prevalent these days, showing up on over 80% of our SERPs, and are quite consistent in appearance across US and UK markets for both desktop and smartphone.
- The organic ranking position PAAs appear at skews slightly lower down on the SERP for mobile when compared to desktop.
- Questions starting with “what” are (still) the most common type of question appearing within PAAs.
- We did come across device-specific PAAs, so it’s important to track both mobile and desktop.
- PAA questions repeat in occurrence, so if you’re able to appear in one, you’ll most likely gain visibility on multiple SERPs.
If you’re curious to dive into the PAAs in your keyword set, head on over to the SERP features tab in STAT or dig into our People Also Ask report. And if you’re not already familiar, say hello and we’d be happy to take you on a personalized tour.
