Missing your keyword referral data? Guest expert Matt Stannard of 4Ps Marketing shows you how to claw some of it back with STAT.
“Are we able to change our tracking code to provide keyword data?”
It’s one of the questions I hear most since Google began hiding keyword referral data from Google Analytics, i.e. (not provided).
Unfortunately, there isn’t a quick and easy fix. However, by using a high-volume rank tracking tool such as STAT, in conjunction with Google Webmaster Tools (GWT) and Google Analytics (GA), you can still see how your ranking keywords are driving traffic to your site.
In this article, I’ll show you how to do this using Excel and a few CSV exports.
Why STAT?
STAT allows us to track the performance of our keywords in the major search engines by location and device.
As well as showing us where our keywords rank, STAT tells us the landing page URL (AKA ranking URL) and the CPC of the keywords. This is really important as we can match this back up to our GA data.
(A word of warning: Ensure that your ranking URL is SEO-friendly. Be careful of filters and virtual pageviews that can interfere with correct tracking in GA. For example, despite the fact that /products/t-shirts.php?orderby=price,asc and /products/t-shirts.php?orderby=price,desc are actually the same page, they can sometimes be tracked as separate pages.)
Why GA and GWT?
GA allows us to track the number of users, sessions and pageviews for our landing pages. It also allows us to look at the value (in terms of conversions or goal completions) of a page.
GWT is in some respects integrated into GA; however, it limits your ability to use secondary dimensions to just a few options. This means that you are pretty much limited to search queries and landing pages in two separate reports, and exporting is limited.
In this case, we’ll be using GWT to give us impressions and click-through rates (CTRs) for our keywords.
Step 1: Get the raw data from STAT
Before you start, make sure you are already tracking all of the keywords in STAT that you want to analyse.
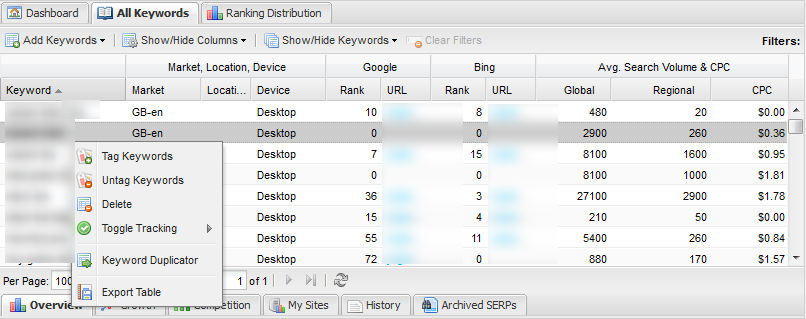
- Go to the All Keywords tab in STAT and make sure that you are showing the Ranking URLs and Search Volume & CPC columns.
- Then, just right-click on the table to export the report as a CSV file. (Select option Only visible columns.)
Exporting from STAT
Rankings, URLs, and CPC data all come from STAT.
Step 2: Over to Webmaster Tools
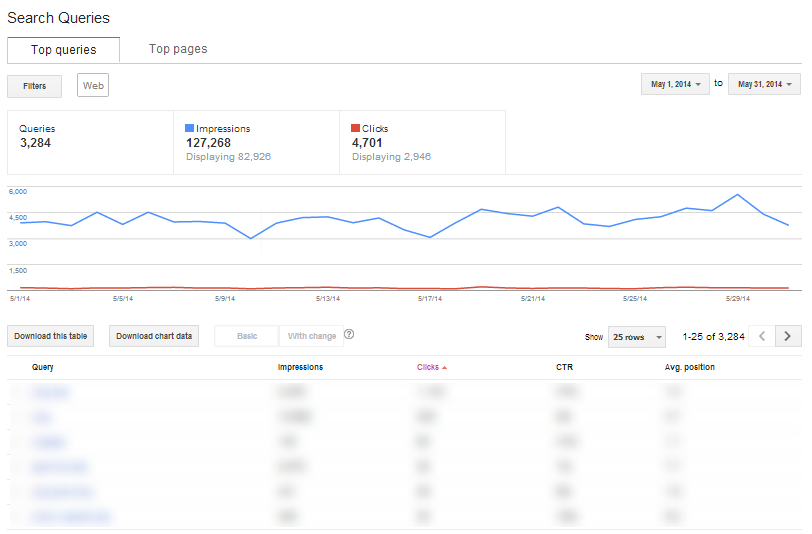
In GWT, Search Traffic > Search Queries shows us all of the keywords that Google believes our site ranks for, with impressions and CTRs included.
- Above the graph, select the date range you wish to analyse.
- Export the data by clicking Download this table below the graph.
Exporting from Webmaster Tools
We grab search query impressions and click-throughs from GWT.
Step 3: Over to Google Analytics
In GA, our final export step is in Behaviour > Site Content > Landing Pages.
- Above the landing page table, click on Secondary dimension.
- Add Acquisition > Source/Medium as your secondary dimension.
- Above the table, click Advanced, and specify Source/Medium > Containing > Google/organic search data. (This excludes other sources of traffic.)
- In the page menu, Export the report as an Excel or CSV file. (I suggest using the Excel export, as the formatting is easier to work with.)
Exporting from Google Analytics
We’re exporting landing pages with Source/Medium as a secondary dimension.
Step 4: Bring the raw data to Excel
Once you have all of your exports, we then can use Excel to join the data together.
- Open each source file and combine them into one workbook, putting each file in on its own worksheet: “STAT Raw,” “GWT,” and “Analytics.”
- Create a fourth sheet called “Warehouse.” This will be keyword-led, and will allow us to pull in relevant metrics from all three data sources.
- Name your warehouse columns:
- Keyword (from STAT)
- Google Rank (from STAT)
- Google URL (from STAT)
- Google Global Search Volume (from STAT)
- Google Regional Search Volume (from STAT)
- CPC (from STAT)
- Impressions (from GWT)
- CTR (from GWT)
- Sessions (from GA)
- CTR Sessions (to be calculated)
- CTR Cost (to be calculated)
- In column A, reference the “STAT Raw” sheet to pull through the keywords:
=’Stat RAW’!A2
Step 5: Populate your warehouse
The next step is to populate the rest of columns in the warehouse sheet based on either the matching keyword (for STAT and GWT) or the matching URL (for GA).
You can do this in a lot of different ways, but I use the VLOOKUP function to find the matching keyword or URL and a named range to populate the data.
Named ranges in Excel save you from using complex cell references. To create a named range, highlight the cells you want included in the range and then type the name in the name box, to the left of the formula bar. (In my spreadsheet, I have named ranges called “statData,” “GWT,” and “GAData.”)
- STAT example
This formula will populate the ranking column:=VLOOKUP(A2,statData,6,FALSE) - GWT example
This formula will populate the CTR column:=IF(ISERROR(VLOOKUP(A2,GWT,4,FALSE)),0,VLOOKUP(A2,GWT,4,FALSE))(I have wrapped the VLOOKUP with ISERROR to return 0 if the keyword isn’t found. This isn’t necessary with STAT as it’s our master source and so everything should be found.) - GA example
This formula will populate the sessions column:=IF(OR(C2="",C2=0),"",(VLOOKUP(MID(C2,SEARCH("/",C2),LEN(C2)-SEARCH("/",C2)+1),GAData,3,FALSE)))(Obviously, this is a little more complex. First, I make sure there is a CTR > 0. Second, in STAT all of the URLs include the full domain, whereas in GA they usually do not; we use the MID function to remove the domain from the beginning of the URL.)
Step 6: Calculate the CTR sessions
To calculate the number of sessions coming from each keyword to each URL, we multiply the keyword CTR (column H) by the number of sessions (column I): =IF(AND​(ISNUMBER​(H2),ISNUMBER​(I2)),I2*H2,0)
(Some additional logic built into the formula allows us to skip over rows with no values for the CTR or sessions.)
Step 7: Calculate the CTR cost
We then multiply the CTR sessions (column J) by the CPC from STAT (column F) to give me an idea as to how much that traffic might have cost if I had to pay for those keywords: =(VALUE(MID​(F25,2,LEN​(F25)-1))​/1.6)*J25
(The addition of “/1.6” allowed me to roughly convert the currency to GBP.)
Step 8: Create a pivot table
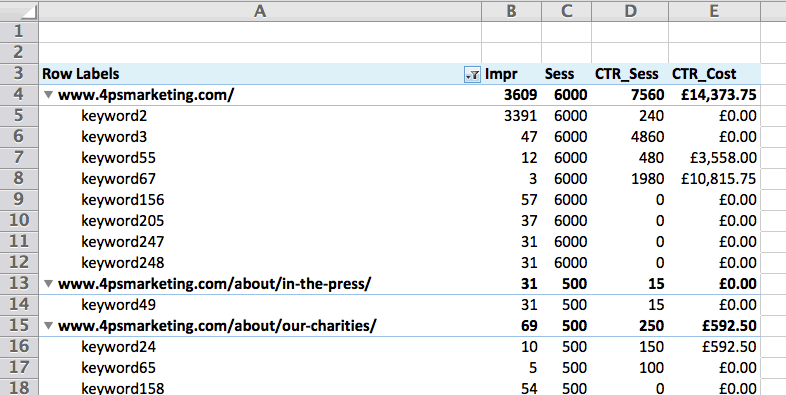
In the end, your warehouse sheet will end up being pretty massive. You can create a pivot table to focus in on just the important stuff: URL, keyword, impressions, sessions, CTR sessions, and CTR cost.
That’s it! You now have a solid idea of which keywords are sending traffic to which landing pages, and how valuable that traffic is compared to paid sources.
Pivot table of reconstructed keyword referral data
Now you can see exactly which keywords are driving traffic where.
Try it yourself
Before you get started, you should know that I’ve made a few assumptions putting this together.
First, I’m assuming that URLs matched in STAT for a keyword are the same as the ones captured by GWT and GA.
Second, if a keyword returns multiple URLs, it may require additional consideration. But at a top level, it still gives a good idea which keywords drive traffic to your site.
If want to see exactly how I put everything together, you can download my sample Excel spreadsheet.
Any questions? Ask me on Twitter @mattstannard. Or, you can email me at matt.stannard@4psmarketing.com.


